Practices of Top Gaining Schools on the ACT

After publishing ACT results for the graduating Class of 2018, PARCA contacted several of the schools and systems in Alabama that showed the largest improvement in average composite ACT scores between 2015 and 2018. PARCA wanted to know what, if anything, the schools did, either specifically for the ACT or in general, to improve students’ college readiness levels.

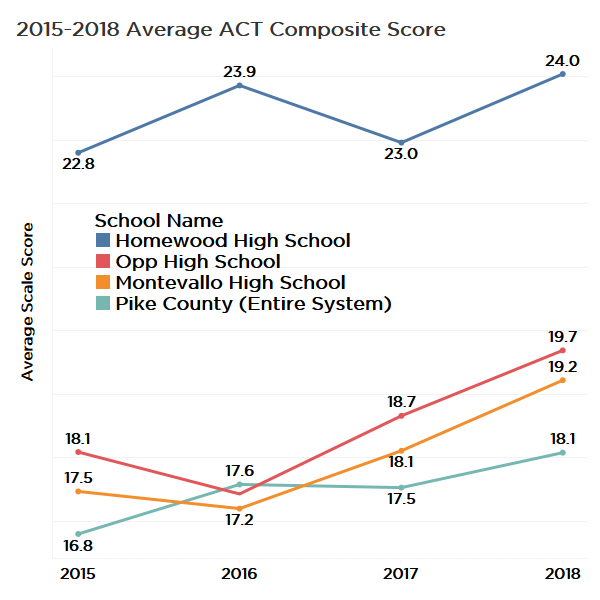
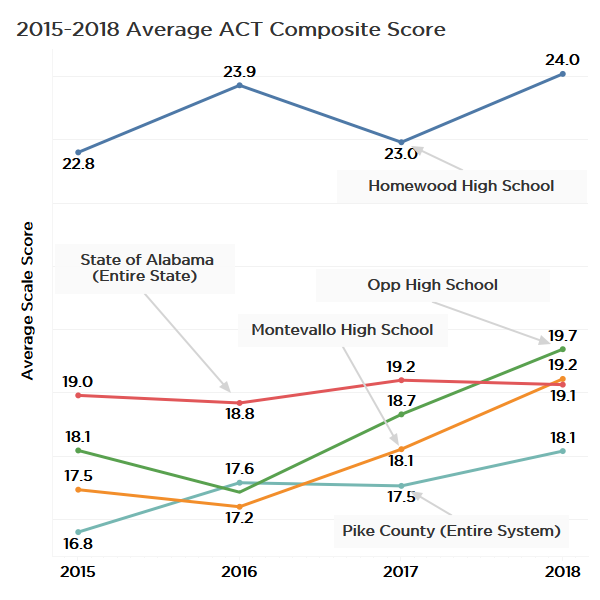
We received responses from the Pike County School System, from Montevallo High School, Opp High School, and Homewood High School and System.   

The schools are across the spectrum when it comes to the economic composition of the student body. Using the percentage of students qualifying for a free school lunch as a measure of economic disadvantage, Homewood (20 percent) and Opp (41 percent) have lower levels of economic disadvantage than the state average (46 percent). Meanwhile, Montevallo High School (54 percent) and the Pike County School System (73 percent) have a higher percentage of disadvantaged students than the state at large. In terms of per-pupil spending, Homewood and Pike County are in the top 20 in per-student funding, while Opp and Shelby County are closer to, but still above, the state average.

Statewide, the average composite score has been basically flat since 2015, rising from 19 to 19.1 in 2018. That tenth-of-a-point gain statewide contrasts with improvements at the responding schools of between 1.2 and 1.7 points on a 36-point scale.

In response to PARCA’s query, school officials described the factors that they believe led to improvement. These are only observations and no underlying studies were performed to prove a cause and effect. However, the approaches described, while not uniform, had common characteristics that have been shown by educational research to lead to improved student performance.

Common Approaches

While the details varied amongst the responding schools, the common themes would not come as a surprise to anyone familiar with education research:

  1. Setting high expectations for all students.
  2. Focusing on the delivery of strategic, high quality, standards-based instruction, not teaching the test.
  3. Monitoring of student progress, providing aid for students who struggle and resources for students who want an additional challenge.
  4. Teaching students to a level of depth expected at the college level, a level that goes deeper than recalling facts.
  5. Emphasizing to students the importance of the ACT and providing access to ACT preparation materials and courses.
Critical Thinking Skills

While all four respondents, to varying degrees, provided targeted preparation for the ACT itself, all emphasized that the real foundation for success was an across the board dedication to a robust standards-based approach to instruction, an approach that challenged students to think beyond surface level of recall of facts, dates, and formulas, and to develop a depth of knowledge and the ability to apply what they learned.

Engaged Faculty

All four viewed the adoption of the Alabama College and Career Ready Standards, standards that included input from the nationally-aligned Common Core standards, were a positive development. The adoption of the new standards provided each system an opportunity to engage faculty in a deep review of what should be taught at each grade level and whether the school curriculum was aligned with the standards. Professional development was provided to ensure teachers were prepared to deliver the content and level of depth called for in the standards.

College-Level Courses

Both Homewood and Opp pointed to the high quality of Advanced Placement (AP) courses. Both systems have added courses and increased access to AP, which are college-level classes delivered in high school. School officials said the high-quality course content and the training teachers receive in order to teach AP classes results into a richer experience for students. That experience prepares them for the more complex level of thinking required to perform well on the ACT. The ACT is, after all, a test that seeks to measure student readiness for college-level work, and AP courses are designed to reflect college-level learning. Homewood emphasized that AP classes at Homewood are open-enrollment rather than selective. Their enrollment continues to grow, as do success rates on the AP test.

Pike County has adopted a different strategy for exposing students to college-level coursework: send them to college. Pike County will have 24 seniors graduating this year with over 60 hours of college credit earned at Troy University or through community college programs. That means those students enroll with enough credit to have earned an associate degree and plenty of experience with college-level work. Beyond the quantifiable results produced for students, the system is spending more efficiently, according to Pike County Superintendent Mark Bazzell. In a small school system, it is difficult to generate the numbers of students participating in AP offerings to justify the investment, especially when college-level courses are already available in the community at the local colleges. Because some national ranking systems look at AP participation as a marker of quality sometimes Pike County receives lower rankings than it deserves considering the opportunities it provides students through the dual enrollment option.

Below are observations from each school or system.


Pike County System

The Pike County School System continues to exceed expectations and draw attention with its attitude of high expectations, no excuses, and its methodical and creative approach to improving outcomes for students. Pike County has been featured in two Business Education Alliance (BEA) reports, Exceeding Expectations (2016) for exceptional performance on the ACT Aspire and in Leadership Matters (2018) for the system’s innovative approaches to improving college and career readiness. PARCA authored those reports, with support and consultation from A+ Education Partnership.

Pike County’s superintendent began the path to the current level of success more a decade ago. When he took over as superintendent, he began a campaign to build a faculty that uniformly believed that all children were capable of high performance. The second step was helping the faculty understand what students needed to know according to the national standards and providing teachers with the training in how to effectively teach those standards.

Bazzell found ACT Aspire, ACT’s suite of standardized tests for elementary and middle school students, to be a valuable tool for accessing student progress. The State used Aspire as its standardized test for accountability purposes but dropped it before the 2018 school year. Pike County now pays on its own for Aspire and uses data from the test to inform instruction. Continuing to use the Aspire exposes Pike County students early and often to ACT-designed standardized test, a test that predicts achievement levels on the actual ACT college readiness test.

Considering its level of student economic disadvantage, Pike County now generates consistent high performance. Bazzell provided the most detail on specific ACT preparation measures the two high schools in the system have adopted.

  • Encouraged students to start taking ACT earlier (9th grade)
  • Increased awareness of the importance of ACT through posters in the hallway, data analysis with students, parent meetings, etc.
  • Teachers’ use of bell ringers (quick questions to open class) that are aligned with ACT questions
  • Implemented Saturday ACT study sessions with content-area teachers
  • Utilized a Discovery Block (time set aside during day) for ACT and PreACT practice, with a schedule that rotated by content area
  • Utilized actcademy.org to create individual study paths based on a student’s PreACT score.
  • Encouraged students to put various ACT prep Apps on their phones and use them during free time at school and at home
  • Included ACT prep materials into a Southern Research Education Board-designed college readiness course, which is now mandatory for students who score lower than a 19 on the ACT
  • Assembled a list of online resources student can use to prepare for the ACT


Montevallo High School, Shelby County System

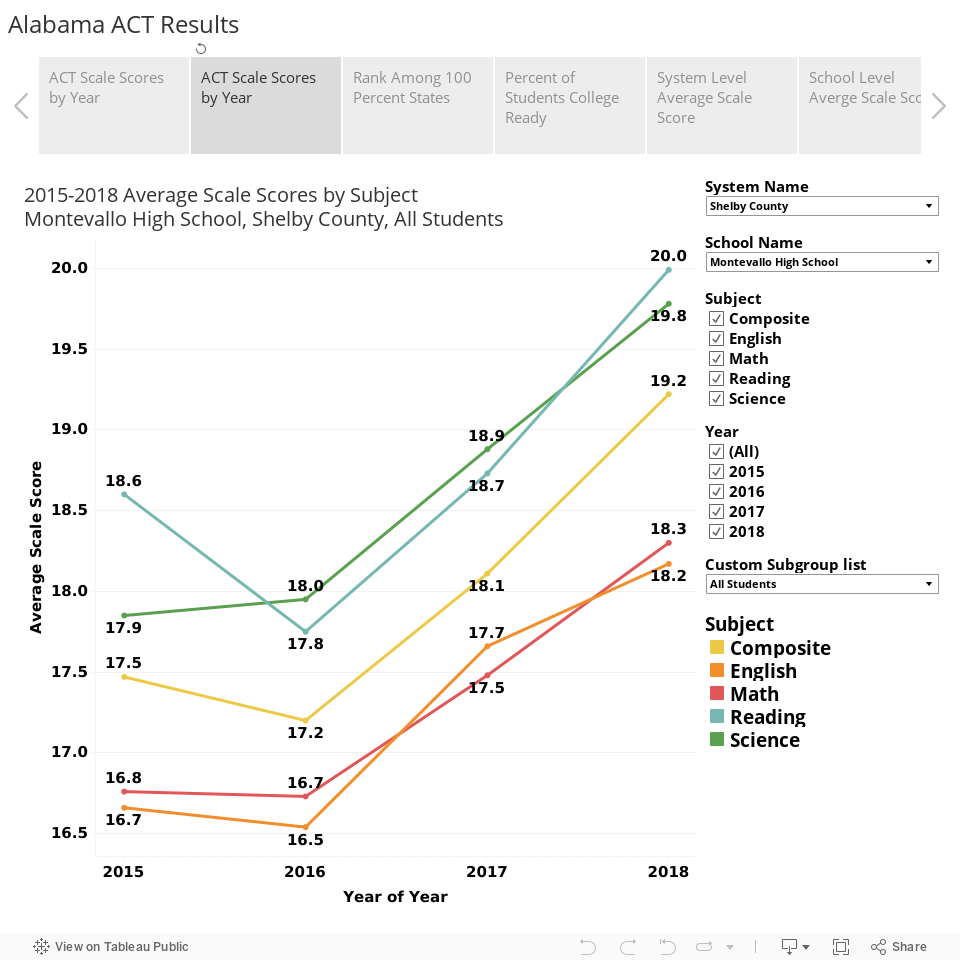
Montevallo High School Principal Brandon Turner, who arrived at Montevallo in 2015, emphasized that his faculty and staff function as a team. Learning targets are set by subject and grade level and formative assessments are administered to track student progress toward the targets.

Turner said a central emphasis for the school is improving instruction and adding depth of knowledge. There is a concept in education called the four levels of knowledge. The first is simple recall, the second level is connecting facts together as concepts or patterns. The third level, strategic thinking, applies concepts learned to novel situations, and the fourth level of knowledge is demonstrating the ability to draw from multiple sources to identify problems and construct solutions.

Questions on the ACT often go beyond recall, simple connections between points of data, and challenge students to think about the bigger picture.

“The depth of knowledge has to be embedded in all your classes,” Turner said. “If we aren’t practicing those things, they won’t succeed.”

Montevallo also offers a guided practice period during lunch that juniors are able to take advantage of, and the week before the administration of the ACT, all the junior classes focus on preparing for the test.


Opp High School, Opp City System

Standards and Active Learning

When Alabama adopted new learning standards, the Opp City System made a systemwide concerted effort to support teachers in understanding and teaching the standards. And it paid off. Opp was featured in 2016’s Exceeding Expectations report for showing the most improvement in math on the ACT Aspire.

Principal Aaron Hightower said the high school continues to focus on teaching that is grounded in learning standards and objectives but is also challenging teachers to innovate in how they teach in order to keep students engaged. For example, teachers at Opp Hike School are encouraged to compress lectures into the first 20 minutes of class and assign group projects to work on for the remainder of the period.

Faculty collaboration

The faculty coordinates across grade level so each grade level subject matter team builds on what has been taught in the previous year and prepares students for the next year.

Course Rigor

For Opp, AP courses have been especially beneficial in increasing the rigor and quality of courses. And, according to Hightower, all courses are supposed to challenge students to think beyond surface level learning.

Diagnostic Tools

To make sure all students stay on pace, Opp uses a diagnostic tool called Edmentum, which measures student skill level and identifies specific areas of weaknesses that need to be addressed. For struggling students, it then prescribes a personalized learning plan to address those weaknesses.

ACT Specific Preparation and Incentives

Opp started offering the PreACT to 10th graders the year before the State made it a requirement. That has allowed students to build familiarity with the kinds of questions the ACT asks.

And finally, to encourage all kids to put in the effort on the ACT, Opp offers incentives. If a student can document a two-point gain on the ACT, they qualify for a school trip to the new water park in Baldwin County.

“Now that creates a buzz,” Hightower said.


Homewood High School, Homewood City System

Instructional Leadership

As with the other responding schools and systems, Homewood school officials first pointed back to the fundamentals of preparation that put students in a position to succeed. Patrick Chappell, the system’s director of instructional support, pointed to the academic focus created in the system by each school in the system having an assistant principal for instruction. Those principals regularly meet with each other and with their faculties during embedded professional learning time to ensure educational continuity classroom to classroom.

Learning Targets

The system has teacher-developed learning targets for students, by grade and by subject. Those targets reflect but often exceed the state’s Alabama College and Career Ready Standards. Despite this tight definition of intended outcomes for students, Chappell said, teachers and students are given latitude on the style and pace of learning. They are not bound by pacing guides, for example. The emphasis is on mastery of standards, not flying through every bit of material.  

AP Courses

Homewood offers an array of AP classes and, in recent years, has seen a continuing rise in the number of students and the percentage of students choosing to take those courses.

Teachers have received additional professional development to prepare for teaching AP classes, and the system also pays for students to take AP exams. 

Access to AP classes is not restricted by GPA or participation in an “honors” program. Any student who wants the rigor and challenge of a college-level course can take AP classes. Even with the rising participation levels, the percentage of students earning a successful score on the AP exams continues to climb as well. With more students succeeding in college-level coursework, it stands to reason that ACT College readiness rates would rise as well.   

Credit Recovery For Struggling Students

Students facing academic challenges have also received targeted attention through an enhanced credit recovery program, promoted by Homewood High School (HHS) principal Zack Barnes. Instead of simply issuing failing grades and having students repeat courses in summer school, the school directs students to online credit recovery programs that allow students to go back and address the specific standards they failed to master.

Test Taking Experience and ACT Prep

HHS Assistant Principal Amanda Esslinger added that Homewood pays for all 9-11 graders to take the PSAT, another college readiness test. This increases students’ comfort level with multiple standardized and timed tests. The multiple measures also create a greater awareness of each student’s strengths and areas of needed growth. That’s useful both to the individual student and to teachers and administrators evaluating the effectiveness of instruction.

Homewood offers an ACT prep class during the school day that any junior or senior can take, giving all students access to preparation that used to be only available to families who could pay for private courses.

Conclusion

Increasing student success on the ACT is important for individual students and can be an important measure of academic effectiveness for schools as well. Schools that generated improvement pointed to some measures that were directly aimed at the ACT such as raising student awareness of the importance of the test and providing access to ACT preparation resources. However, those schools and systems that improved first emphasized a commitment to delivering instruction that allows students to meet and exceeds expected standards of learning for their grade level. They also emphasized exposing all students to the deeper levels of learning expected for college level academic performance.


Alabama County and MSA Population Trends

The latest estimates from the U.S. Census Bureau show continued strong growth in the Huntsville metropolitan statistical area (MSA), slightly positive growth in the Birmingham MSA, and slight declines in Mobile and Montgomery metro areas. For 2018, Huntsville’s growth rate ranks No. 64 out of the nation’s 383 metro area. But Alabama’s other large metros lag behind peers in terms of percentage change in population, with Birmingham ranked No. 251 out of 383, Mobile, 324, and Montgomery, 327.

Meanwhile, only 22 out of Alabama’s 67 counties added population in 2018. Most rural counties lost population, while most counties connected to a metro area gained. However, three of the four most populous counties home to the urban cores of the major metros areas — Jefferson, Montgomery, and Mobile — experienced net losses in 2018 as outmigration to surrounding suburban counties continued. Madison County, home to Huntsville continued to gain.

PARCA has updated its interactive maps and charts that allow users to explore local population changes and trends. PARCA tools for state-level population estimates were updated earlier this year. Estimates for cities will be released this summer.

Huntsville MSA

The Huntsville’s 462,693 person MSA includes Madison County, home to Huntsville (Pop. 366,519) and Limestone County (Pop. 96,174). Madison County is second only to Baldwin county in numeric population growth since 2010, and according to the estimates it added more people than ever in 2018, an estimated 4,854 in 2018. Limestone County is now the state’s second fastest growing county in percentage terms, adding 2,098 people in 2018.

Huntsville’s growth seems to be aiding population growth in other neighboring counties outside the Huntsville MSA. Marshall County has been steadily gaining population for most of the decade and now Morgan County, home to Decatur, has turned positive according to the estimates. That has caused the Decatur MSA to break a streak of population losses stretching back several years.

Birmingham-Hoover MSA

At 1.1 million and including seven counties, Birmingham’s MSA is more than double the population of second place Huntsville’s two-county MSA. In fact, Jefferson County, the central county of the Birmingham-Hoover MSA with 659,300 residents is significantly more populous

The estimates show Jefferson County with a slight loss in 2018, down 246 people. Since 2010, the estimates show Jefferson County with a net gain of 794 residents. Population change is driven by natural increase (births vs. deaths) and migration (net domestic migration plus net international migration). Jefferson County’s birth rate exceeds its death rate so the county adds people, 14,120 since 2010. But the county has a net outflow of residents moving elsewhere in the state or the country: 18,215 more people moved out than moved in. That would set the county up for net loss in population if it weren’t for a net inflow of international migrants. Jefferson County has added 5,335 of those since 2010, according to the estimates. While international in-migration has offset population loss in Jefferson County, and in other core counties as well, levels of international migration have dropped in the last two years.

Where are the leavers going? Adjacent Shelby and St. Clair Counties experienced net positive domestic migration adding 10,368 and 3,820 respectively since 2010. Walker, Blount, Bibb and Chilton County had more people moving out to other parts of the state or country than moving in according to the estimates. Blount and Chilton offset those losses with mild gains through natural increase and international migration. Walker and Bibb did not.

Mobile

With 413,757, residents Mobile is the state’s third largest MSA and it consists of a single county, Mobile, the state’s second most populous county. The federal government determines which counties are joined together in metro areas. Mobile County lies adjacent to the state’s fastest growing county, Baldwin. Despite the obvious connections between the two counties, the level of commuting between the two counties isn’t high enough for the federal government to consider them a single metro.

Mobile county’s population dynamics mirror Jefferson, with a net outflow of domestic migrants offset by a positive natural increase and international in migration.

Baldwin, on the other hand, is growing, like no other county in Alabama. It has added an estimated 35,758 residents since 2010. The county is also a metro area of its own, known as the Daphne-Fairhope metropolitan statistical area. What is driving growth: heavy domestic in-migration, particularly from individuals over the age of 60.

Samford University sociology professor Don Bradley has analyzed late-in-life migration for unpublished white paper commissioned by Where to Retire Magazine. In his review of Census data, Bradley found that Baldwin County was receiving 1,798 new residents over the age of 60 each year. That ranked Baldwin among the top 30 areas in the country for receiving persons 60 and over. That same elevated growth pattern can be seen in many coastal counties from North and South Carolina, and Florida, as well as retirement hotspots in Arizona and Nevada.

Montgomery MSA

Of the major metro areas, only Montgomery has seen a net population loss since 2010. Within the metro area, Montgomery County has lost an estimated 3,615 since 2010, and the slight gains in Elmore (2,594) and Autauga (1,027) have not been enough to offset the loss.


Smaller Metros

Perhaps influencing Montgomery’s population stagnation is the draw of Lee County, also known as the Auburn-Opelika MSA. It has the second fastest rate of growth and ranks third among Alabama MSAs in numeric growth, having added 23,641 residents since 2010.

In addition to the being home to Auburn University, Lee County lies between the two Korean automakers, Hyundai in Montgomery and Kia in West Point, GA. In terms of county growth, Lee’s neighboring county, Russell, is also adding residents at a healthy pace. Russell, home to Phenix City, is considered to be part of the Columbus, GA metro area, which has seen growth over the decade. The army base, Fort Benning, on the Alabama Georgia border is a major driver of population dynamics there.

Across the state, Tuscaloosa as a county and as a metro area continues to see growth, almost all of it concentrated in Tuscaloosa County, which has added 14,243 residents since 2010 according to the estimates. Pickens County has seen a slight gain in population since 2010 but Hale County also included in the Tuscaloosa MSA, has lost about 1,000 residents since 2010.

While the Dothan MSA is off the major interstate corridors, it has continued to post modest population growth. Houston County, home to Dothan, has added 3,168 since 2010, according to the estimates, while Henry and Geneva Counties have shown slight declines over the period. Houston’s population growth stemmed from positive natural increase and positive migration.

In the northwest corner of the state, the Florence-Muscle Shoals metro area saw about the same level of domestic in-migration as Dothan. But the two counties Lauderdale and Colbert both have negative rates of natural increase, meaning that more deaths are occurring in those counties than births. Negative rates of natural increase tend to show up in places where the population is disproportionately elderly.


The two remaining MSAs Anniston-Oxford, comprised of Calhoun County, and the Gadsden MSA (Etowah County), also have negative rates of natural increase. And both those counties have negative migration rates, more people move elsewhere than relocate to those counties. Both of the counties have lost population throughout the decade.

Among Alabama counties, Dallas County, home to Selma has had the steepest losses with an estimated 5,508 loss in population since 2010, a decline of 12.6 percent. Two other Black Belt counties, Perry and Macon are declining faster than Dallas in percentage terms. Perry County lost 13.6 percent of its population since 2010 according to the estimates, while Macon County lost 14 percent.


How Do States Choose State Boards of Education and State Superintendents?

The Alabama Legislature is currently considering a bill that would potentially overhaul state education governance and policymaking as it relates to K—12 public schools in the state. The bill, which has already passed the Senate, would abolish the elected State Board of Education and the Board-appointed position of State Superintendent of Education. The bill would create a Governor-appointed Commission, the Alabama Commission on Elementary and Secondary Education. The Commission would appoint a Secretary of Elementary and Secondary Education to be approved by the Senate. If approved by the Legislature, the proposal will be placed on the statewide ballot as an amendment to the Alabama Constitution.  

State commissions or boards of education and chief executive officers, whether they be superintendents or secretaries are central to state education governance. The process used for their selection has implications for accountability, decision-making, and setting priorities for a state’s K—12 education system.

All but two states (Minnesota and Missouri) have a school board or commission. Eleven states have elected school boards (12 if including the district of Columbia). The rest have appointed boards, most of which are appointed by the governor. States with elected school boards or commissions are listed below.

States with Elected Boards

  • Alabama
  • Colorado
  • Kansas
  • Louisiana
  • Michigan
  • Nebraska
  • New Mexico – only an advisory group
  • Nevada – Mixture of elected and appointed members
  • Ohio
  • Texas
  • Utah

The proposal before the Legislature resembles the governance structure currently in place in 12 states in which the governor appoints the school board and the board appoints the superintendent.

Education Governance

Why does this matter? States have the responsibility for implementing federal education law and developing, implementing, and managing state-level policies. For this to work well, several institutions must work well together.   

State legislatures must pass effective legislation.

Governors can propose education legislation and have the statutory authority to approve or veto legislation. As the state’s chief executive, the governor carries out the laws passed by the legislature. They can also play an important role in shaping the priorities of a state board when they have the power to appoint. In some states, as in Alabama, the governor serves as president of the school board.

State boards of education are responsible for statewide curriculum standards; high school graduation requirements; qualifications for professional education personnel; state accountability and assessment programs; standards for accreditation of local school districts; preparation programs for teachers and administrators; administration of federal assistance programs; and the development of rules and regulations for the administration of state programs. State boards are often seen as the lay representative of the state’s population and as the liaison between professional educators and policymakers. Boards should play a role as advocates for education and, in some states, have been influential in building consensus on state education policy.[1]  

Finally, state superintendents are responsible for administrative oversight of state education agencies and implementation of state law and board policies. Policy making can occur as superintendents interpret laws and policies they are responsible for implementing.

A report issued by the Education Commission of the States (ECS) outlines how state boards and state superintendents are chosen in varying states, and how the majority of states fall into one of four models. These models, described below, have implications for how state leaders work together in setting priorities and implementing policies.[2]

Model 1: Governor Appoints Board and Superintendent

In 10 states (Delaware, Iowa, Maine, New Hampshire, New Jersey, Pennsylvania, South Dakota, Tennessee, Vermont, and Virginia), the governor has the most power in setting priorities and ensuring they are implemented.

Consequently, the superintendent and board should both be aligned with the governor, though the superintendent may feel more independent of the board than in other models where the board appoints them. The governor is accountable to the voters and can be held more directly accountable for the status and effectiveness of education in the state

Model 2: Governor Appoints Board and Board Appoints Superintendent

In 12 states (Alaska, Arkansas, Connecticut, Florida, Hawaii, Illinois, Kentucky, Maryland, Massachusetts, Missouri, Rhode Island, and West Virginia), the governor still has power in shaping the education agenda but has less direct control over the implementation of policies through the superintendent’s office, as compared to Model 1. The Board and Superintendent would potentially have a closer relationship than found in Model 1. The proposed Commission in Alabama fits this model.

Model 3:  Governor Appoints Board while Superintendent is Elected

In 10 states (Arizona, California, Georgia, Idaho, Indiana, Montana, North Carolina, North Dakota, Oklahoma, and Wyoming), voters may see different platforms for education supported by the governor and the superintendent. The governor appoints the board, and this becomes a channel through which policy is formed. The superintendent may exercise more autonomy in interpreting those policies and how they will be implemented in the state.

Model 4:  Board is Elected and Appoints the Superintendent

In Alabama and five other states (Colorado, Kansas, Michigan, Nebraska, and Utah), the governor and the board are both directly accountable to voters. Since the board appoints the superintendent, this increases their power. In this model, the governor is likely in the weakest position to craft or control the education agenda, compared to the other models. According to ECS, states using this model potentially face stronger challenges aligning and collaborating across state leadership, unless the voting public is clear in its desires. When alignment is not present, states will likely face limitations in pushing for ambitious policy changes. At the same time, an elected board will be highly responsive to voters and will seek out their opinion, preferences, and needs.

According to ECS, twelve additional states (Louisiana, Minnesota, Mississippi, New Mexico, New York, Nevada, Ohio, Oregon, South Carolina, Texas, Washington and Wisconsin function under modified versions of the above models. Five of these elect their board, though New Mexico’s is only an advisory commission. Two of these states elect their state superintendent. No state elects both their state board and superintendent.

Elected and Appointed State Boards: Strengths and Weakness

The process for selecting the board and superintendent can influence the goals for these officials. Some groups, including the National Association of State Boards of Education (NASBE), emphasize the role of state boards in representing the interests of the lay public in accordance with democratic principles. Whether elected or not, NASBE contends that:

“State boards of education are integral to the governance of public education in the United States. State Boards, operating as a lay body over state education, are intended to serve as an unbiased broker for education decision-making, focusing on the big picture, articulating the long-term vision and needs of public education, and making policy based on the best interests of the public and the young people of America.”

Elected board members are charged with asking important and challenging questions that lead to good policy. The question is whether boards effectively play this role.

Proponents say elected boards are more responsive to the public will. As elected officials, board members have their rightful place and, ideally, are only responsible to the people who elected them. They should be more empowered to oppose what they believe is not in the interests of the state’s schools and children.

At the same time, as elected officials, re-election is an important goal, if not the central goal. Thus elected board members may find themselves where the interests and desires of voters conflict with policies, programs, and practices that best serve children.

Conversely, proponents of appointed boards cite the strength of the vetting process in creating boards with knowledgeable, skilled, effective board members. An appointment process allows the governor to consider the needs of the board and the qualities different candidates would bring. Others cite that governor-appointed boards and appointed superintendents create a more efficient, aligned, and harmonious system for setting and implementing education priorities. Ambitious and substantive changes to a state’s school system are more feasible in a more efficient system that encourages collaboration and strengthens the governor’s capacity to effect change. However, while somewhat insulated, appointed boards are not immune from political pressure. 

Conclusion

The selection process for state school boards and state superintendents is important, and there are reasonable arguments for both elections and appointments. Regardless, the selection process will not remove politics. The nature of the task — setting and implementing the state’s K—12 education policy — means state school boards will likely always be politicized to some degree.

Thus, it is essential to establish both an effective governing structure and qualified leaders committed to strengthening teaching and learning in Alabama.

A quality education is how dreams are realized and the people’s voice is strengthened.


References

[1] National Association of State Boards of Education (2019). “State Board of Education Responsibilities”

[2] Education Commission of the States (2017). 50-State Comparison: K-12 Governance Structures.”