Thank God For Mississippi: They’re Leading the Way on Educational Progress

At least in terms of education, it’s time to retire the old Alabama catchphrase, “Thank God for Mississippi.”

It’s an easy response when the latest list comes out that finds Alabama and Mississippi at the bottom of the rankings.

Frequently, Alabama bests Mississippi, and, in so doing, stays out of last place.

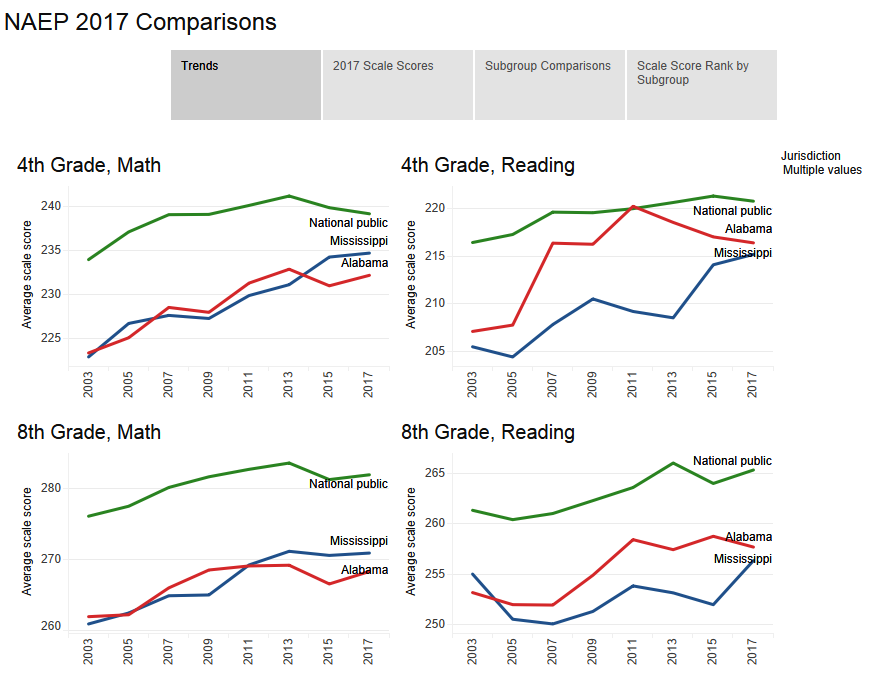
However, a review of the latest results on the National Assessment of Education Progress (NAEP) shows Mississippi students now outscore Alabama students on almost every measure.

In 4th and 8th grade math, Mississippi continued its multi-year rise in performance. Comparing all students in each state, Mississippi has a higher average scale score at both grade levels and higher percentages of students scoring proficient.

In reading, Alabama still outscores Mississippi when all students’ scores are averaged together, though the gap between the two states continues to close.

But looking deeper in the data, in every major subgroup measured, Mississippi students are outscoring Alabama students. When comparing Alabama’s white students to Mississippi whites, Alabama black students to Mississippi black students, Alabama Hispanic students to Mississippi Hispanics, Alabama poverty and nonpoverty students with their counterparts in Mississippi, on all those measures, Mississippi comes out on top.

Comparing the different subgroups with their peers in other states provides some assurance for Alabama. Both Alabama and Mississippi tend to show up poorly on “all students” rankings on standardized tests. That is due in part to the fact that historically disadvantaged groups — students from low-income households, blacks, and Hispanics — tend to score lower on standardized tests than whites and students from nonpoverty households. Alabama and Mississippi both have higher percentages of students in poverty and higher minority percentages than most states.

Breaking out the scores by subgroup allows a more nuanced comparison. When comparing subgroups, Alabama’s performance is better in some instances than the overall ranking might suggest. For instance, in 4th-grade math, Alabama’s “all students” rank is fourth from the bottom among U.S. states. However, when directly comparing black students, Alabama black 4th graders outscore black students in 14 other states.  A deeper examination of subgroups brings to light some important points.

  1. It is certainly not the case that Alabama’s lackluster performance on the NAEP can be blamed on black students or poor students. On some measures, blacks and poverty students in Alabama earn a higher national ranking in their respective categories than whites and nonpoverty students.  It is weak performance across all subgroups — black and white, poverty and nonpoverty — that weighs on Alabama’s competitive position.
  2. There is one subgroup that is especially in need of increased attention from Alabama educators: Hispanics. In both grades and both subjects, the average scale score for Alabama Hispanics was lower than the average scale score for Hispanics in any other state.

In the rank table below, you can explore the average scale score of each Alabama subgroup ranking nationally. Bear in mind that the rank for white students, poverty and nonpoverty students includes all 50 states. For Hispanics, there are 47 states in the comparison group, because in three states there weren’t enough Hispanic students tested to generate a statistically valid sample. For black students, the rank is among 40 states on all measures except 4th-grade math. In 4th-grade math, the comparison group includes 42 states.

Looking more broadly,

  1. Alabama has focused attention on instruction in the early grades and evidence from NAEP shows that has provided benefits. In 2011, Alabama tied the national average in 4th-grade reading. Despite some erosion since then, 4th-grade reading remains stronger than other subjects. In math, Alabama 4th graders improved from No. 50 in 2015 to No. 48 in 2017. Obviously, sustained focus on the early grades remains important.
  2. However, Alabama’s NAEP results in 8th grade remain consistently poor in both reading and math. Middle grades instruction also deserved concerted focus and investment.
  3. Alabama should study Mississippi’s approach to see if that state’s progress can provide lessons. While more in-depth analysis is needed, Mississippi education officials credit that state’s progress to continuity of leadership and a sustained, systematic approach to supporting its school districts. The current superintendent, Carey M. Wright, took office in 2013, recruited from the District of Columbia where she was Chief Academic Officer. Mississippi adopted new higher academic standards and set up a system of professional development to help Mississippi teachers teach to the new standards. Mississippi also implemented a literacy initiative similar to the Alabama Reading Initiative but targeted the initiative primarily at high need schools. On the surface, Mississippi’s efforts mirror Alabama’s, a deeper look might reveal ways in which Alabama’s approach can be adjusted in order to produce similar results.

ACT Aspire: 2017 Results and a Final Look Back

The ACT Aspire, a suite of standardized tests given statewide to students in grades 3-8 and 10, has been the State of Alabama’s primary tool for measuring the academic progress of Alabama public schools since the 2013-2014 school year.

Over the course of four administrations of the Aspire, students showed progress on most measures. By 2017, the percentage of children scoring proficient on the Aspire had improved in most grades and subjects, in some cases significantly. (To explore the data on your own, including views that allow for interactive comparisons between selected schools and systems, follow this link. To view the visualization in full screen, click the button on the bottom right corner).

The gains in math were the strongest. All grades saw steady improvements, except for 10th grade where the percentage proficient was basically flat. The implementation of Aspire roughly coincided with the adoption of new state standards in mathematics, which were intended to increase students’ depth of understanding of mathematical concepts. Though the Aspire has now been replaced by a different standardized testing system developed by Scantron, math proficiency levels will continue to be of crucial interest. On the National Assessment of Educational Progress (NAEP), the national benchmark testing system, Alabama students have been at or near the bottom of the country. On the 2017 NAEP, Alabama students posted slight gains (Click here for Alabama 2017 NAEP Results). Continued improvement in mathematics instruction is needed.


In reading, the percentage of children scoring proficient improved modestly in grades 3-6, but results for grades 7, 8 and 10 were mixed. Alabama had made significant progress in reading achievement, progress that coincided with investment in and deployment of the Alabama Reading Initiative (ARI). In the wake of the Great Recession, funding for the program was cut and school systems were given the flexibility in their use of ARI funds. The most recent state budget included a $4 million increase for ARI but stipulated that the program return to its initial focus on early grade reading.


Aspire tests for science were not uniformly administered for all grades in all years, but in the years and grades available, gains were also made in that subject.


In Alabama and across the country, the differences in the proficiency rates among various subgroups of students remains a concern. In both the state and the nation, the percentage of students from poverty backgrounds scoring proficient is about 25-30 percentage points lower than the percentage of nonpoverty students scoring proficient. Similar gaps between whites and blacks, and whites and Hispanic students.


As a result of those gaps, the percentage of the student body in a school system tends to predict the overall proficiency levels achieved by the students on these standardized tests. The scatterplot chart below shows this general correlation between proficiency levels and poverty levels. A school system’s proficiency rate determines its vertical position on the chart (higher on the chart, the higher the proficiency rate). A system’s poverty percentage, based on the percentage of students directly qualifying for free meals under the National School Lunch Program, determines the system’s position on the horizontal axis, with higher poverty districts to the left of the chart and lower poverty districts progressing to the right.

Though the correlation is obvious, it is also obvious that systems with similar poverty levels often show very different proficiency levels. In other words, the school systems can and do exceed expectations, through effective teaching, resources, and organization.

As a testing tool, Aspire had both fans and detractors. Critics complained that resources for preparing for the test were lacking and that results were not provided quickly. They also questioned whether the tests were properly aligned with the state’s course of study. Fans appreciated the fact that Aspire results were aligned with the ACT, the widely used college entrance exam. Thus, a student’s score on the Aspire tests served as a predictor for eventual performance on the ACT.

The test’s results, which showed lower proficiency rates than the previous state test, the Alabama Reading and Math Test, were also considered by many a more accurate reflection of students’ performance. Aspire proficiency levels for Alabama students were closer to the results Alabama students produced on the National Assessment of Educational Progress, though Aspire proficiency percentages were still higher than Alabama NAEP proficiency levels. Here is a comparison of Aspire and NAEP results for Alabama, with the proficiency levels for national public schools included for comparison.

JurisdictionTest% of students at or above Proficient
4th Grade MathNational publicNAEP40%
AlabamaNAEP31%
AlabamaAspire49%
4th Grade ReadingNational publicNAEP35%
AlabamaNAEP31%
AlabamaAspire39%
8th Grade MathNational publicNAEP33%
AlabamaNAEP21%
AlabamaAspire30%
8th Grade ReadingNational publicNAEP35%
AlabamaNAEP28%
AlabamaAspire46%

PARCA Gubernatorial Candidate Forum Brings Leaders Together to Discuss Alabama Priorities

This past Wednesday, May 16th, PARCA held a 2018 Gubernatorial Candidate Forum at Woodrow Hall in Birmingham. The event was hosted by the PARCA Roundtable, PARCA’s young professionals’ group of 28 to 45-year-old civic and business leaders. It was a great opportunity for Democrat and Republican candidates to come together and express ideas in a nonpartisan environment prior to the June 5th primary election.

Participating candidates included Tommy Battle, Sue Bell Cobb, Scott Dawson, James Fields, Bill Hightower and Walt Maddox.

The forum featured one-on-one conversations with each candidate. The six conversations were led by PARCA Roundtable members Victoria Hollis, Peter Jones, and Kendra Key, young professional civic leaders Anthony Hood and Bridgett King, and WBHM News Director Gigi Douban.

A number of the questions specifically addressed the concerns of young professionals. Candidates were also asked about many of the issues most important to voters, as reported in PARCA’s recent Alabama Priorities. At the end of the event, all six candidates came to the stage for questions from the audience of around 135.

Some of the main ideas expressed throughout the evening focused on education, taxes, workforce development, the correctional system and the state’s image.

A collegiality emerged between the candidates throughout the evening, and for a few moments, there were no political parties, only public servants interested in improving the state of Alabama.