The Poverty vs. Performance Challenge

PARCA continues to explore the results of the state’s new standardized test, the Aspire, and is developing new ways of looking at the data.

Aspire was developed by the same testing company that offers the college readiness benchmark test, the ACT. From grades 3-8, Aspire measures student progress at each grade level toward an eventual goal of graduating from high school ready for college-level work. In the graphics below, we will look at the average percentage of students scoring “proficient” on the Aspire. A student scoring at or above proficient is considered “on track” in the journey to success in college.

Below are three new glimpses of Aspire results from 2014.

In each of the graphs, the circles represent school systems. A system’s horizontal position is determined by the percentage of students in that system qualifying for a federally-funded free or reduced lunch, a marker of poverty. Systems are arranged from 100% poverty, on the left, down to 0% poverty, on the right.

A system’s vertical position represents the percentage of test scores at or above proficient. The higher the circle the greater the percentage of students scoring proficient.

These three graphs within the chart below represent blended results for math and reading from grades 3 through 8. The first looks at the results for “all students” in a system. Then, using the menu at the top, you can also view the results for students from nonpoverty and poverty backgrounds. The red line through the middle represents the relationship between proficiency and poverty. In effect, this line shows the typical proficiency level for a school system, given the level of poverty among its students.


What do you see in the results? The first observation is the most obvious. When results from all students are considered, systems that have higher rates of poverty have a lower percentage of students reaching proficiency. This is not a new finding. Students coming from a background of poverty tend not to do as well on these test as students from nonpoverty households. This is consistent with results produced in Alabama and nationwide for many years. Closing this achievement gap is one of the great challenges of public education.

At the same time though, these graphs also indicate that schools and school systems make a difference. Those systems that are above the average line are outperforming expectations. There are lessons to be learned from those systems. It is also obvious from the wide span of performance among poverty students, that poverty status does not dictate results. In some systems, children from poverty backgrounds are succeeding at much higher rates than in others. It will take further study to isolate the secrets to success.  

There is even more promise when you look at results at the school level. In the graph below, you can see the wide variation in success rates. Identifying successful schools and learning from their approaches should be a priority for the state and for struggling systems that want to improve.
Setting the Course for Continuous Improvement in Tuscaloosa City and County Schools

Thanks to Plan 2020, the state’s strategic plan for improving the state’s public schools, schools and the communities they serve have increased access to data on school performance measures.

Local systems are examining how their students perform on the Aspire, the new benchmark test given to student in grades 3 through 8. Systems are also tracking graduation rates, remediation rates, and scores on the ACT, the widely-known college readiness test.  These performance measures, and others, can be used in goal-setting and evaluation. Through a careful analysis of the results, school systems can recognize areas of strength and areas of weakness, and then craft plans to improve.

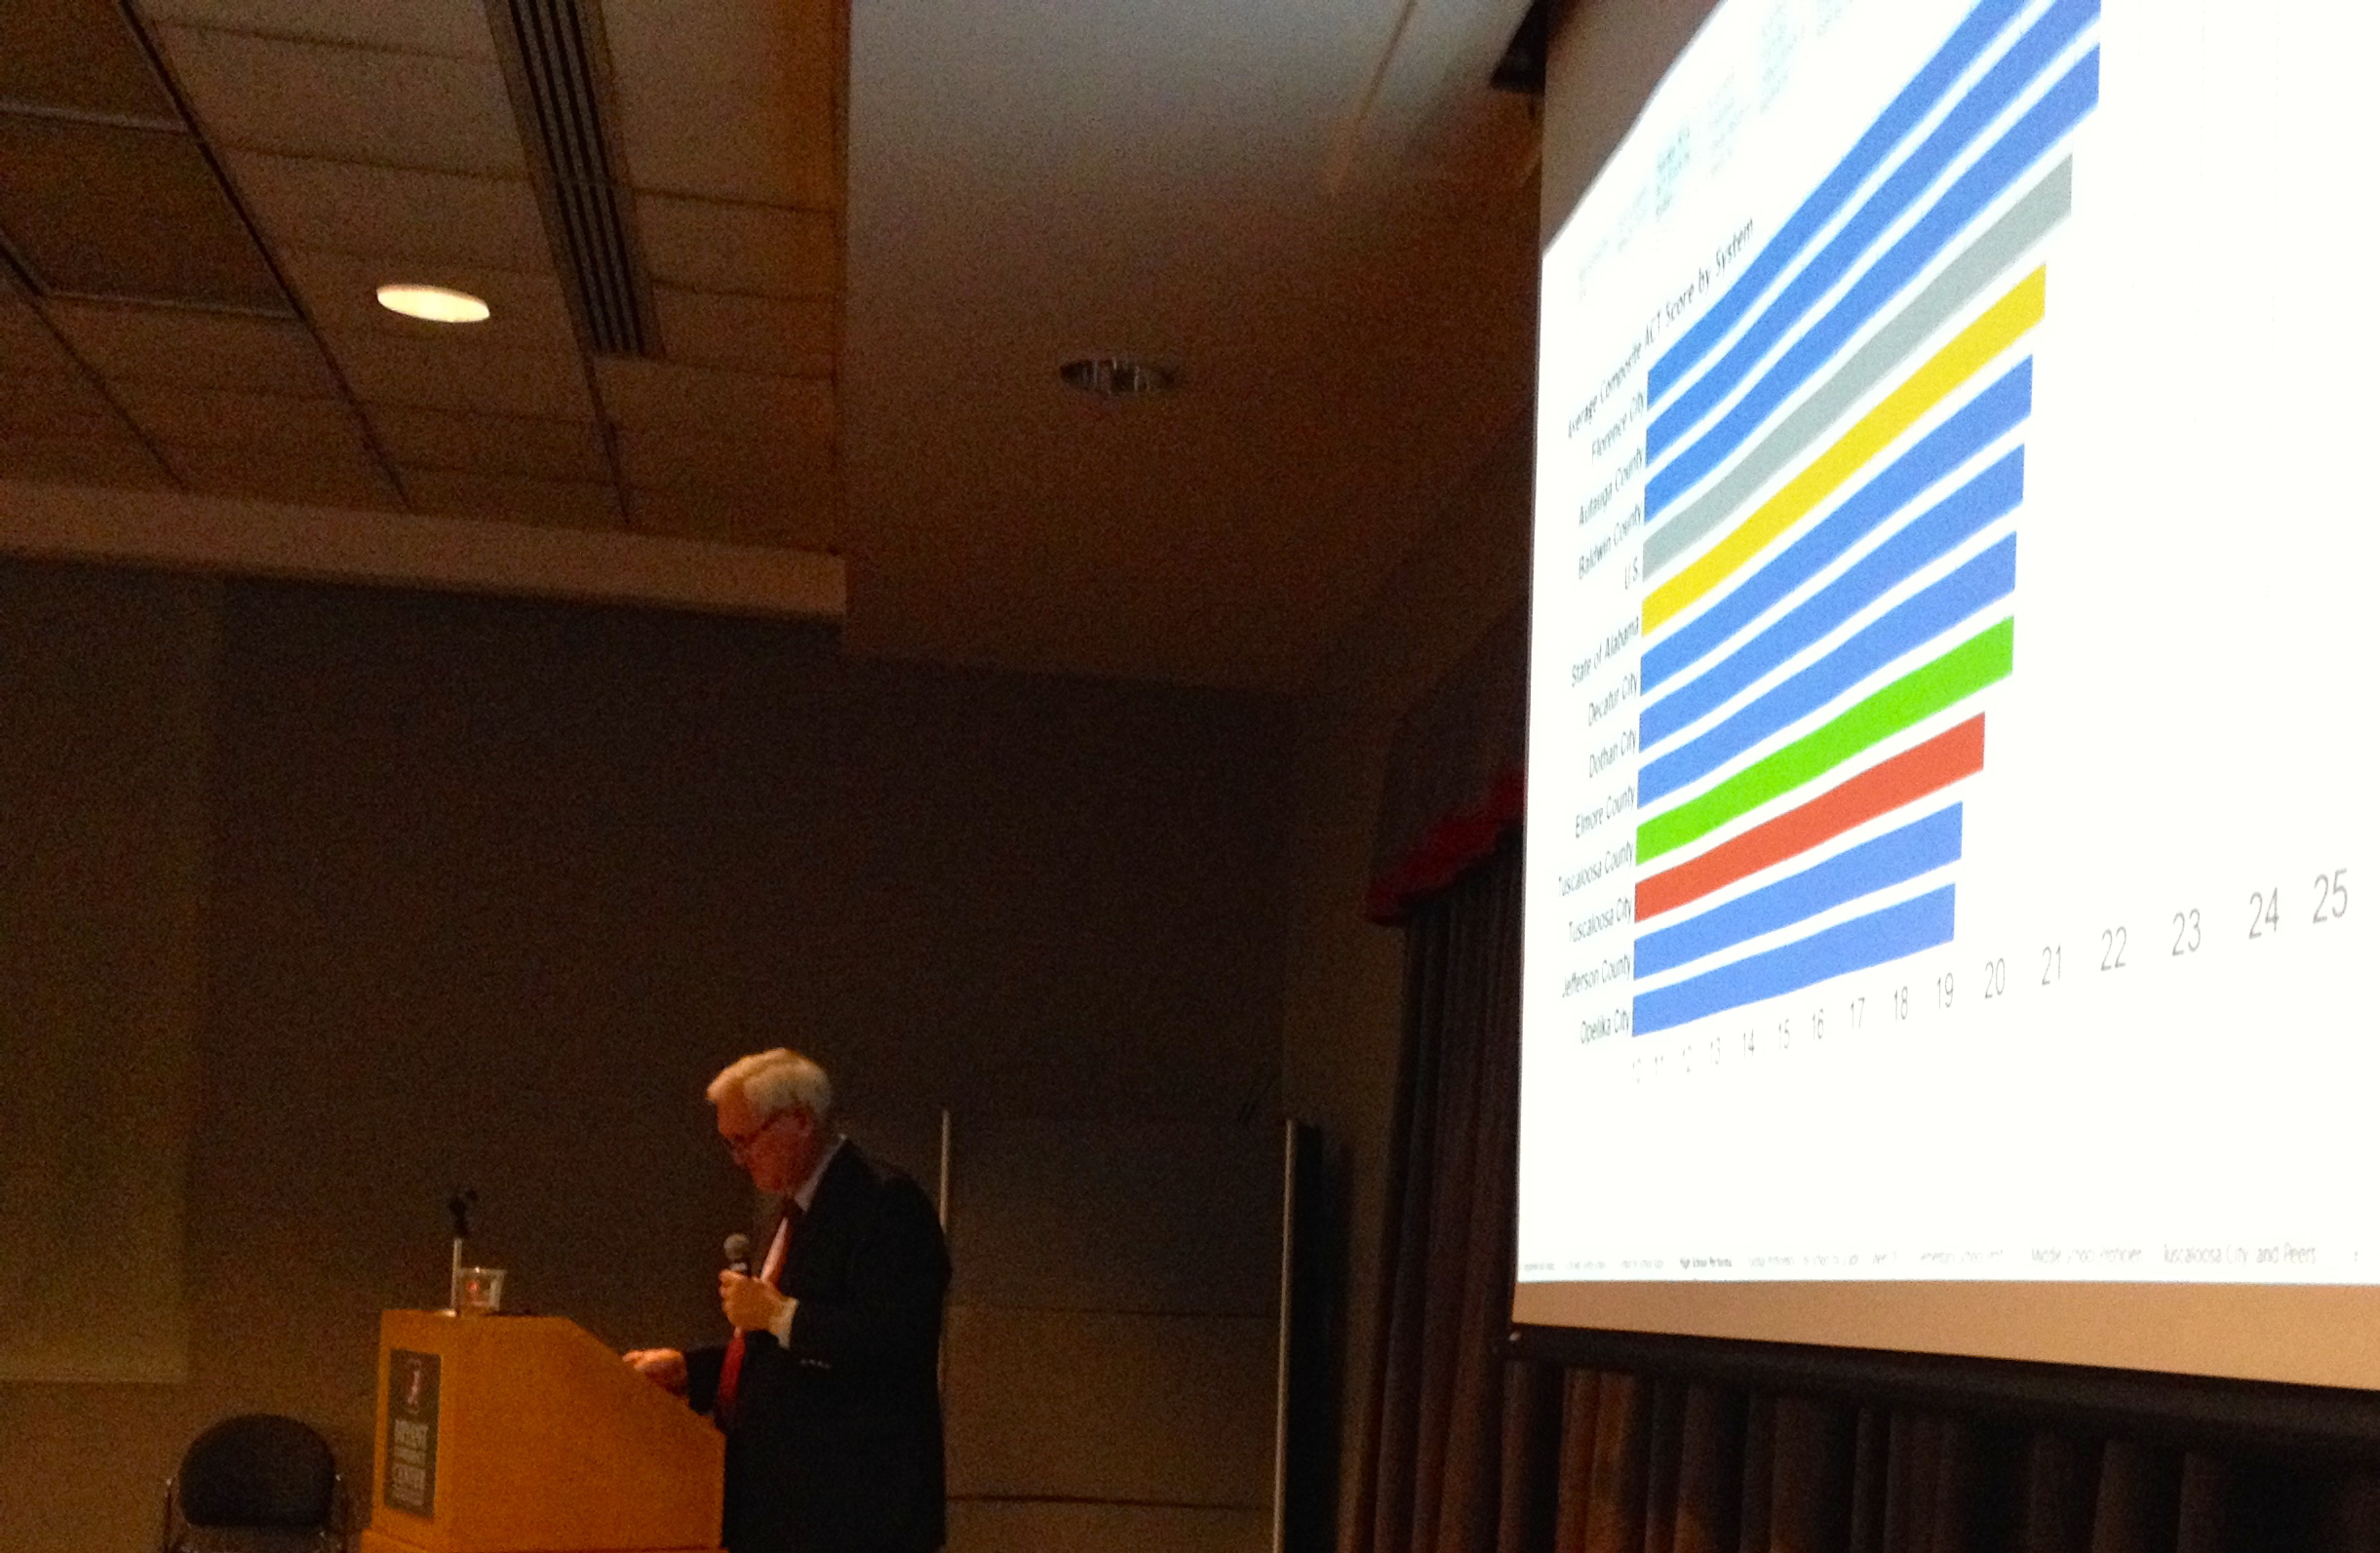
In Tuscaloosa, The West Alabama Chamber of Commerce and the Schools Foundation, for the third year in a row, commissioned PARCA to take a close look at the Tuscaloosa City and County Schools Systems and present the results to city and county school leaders and to the public at large at their annual Education Summit, held this year on June 16.

PARCA’s report put the two systems’ results in context, describing the financial and personnel resources each system has to work with and the demographics of each system’s students. PARCA identifies similarly situated systems in the state, creating a peer group of schools, and then compares the Tuscaloosa City and Tuscaloosa County results with those of peer systems.

“We believe that every student can learn at higher levels, and that means every school can improve its results from year to year,” Williams told the audience. “There is no such thing as a perfect school or school system, or a perfect organization of any type for that matter. A school system has a number of goals, and it needs to focus on meeting all of them. Like any organization, it will do some things very well, other things pretty well, and still others not so well. So we don’t give school systems a single rank. Rather, we analyze the key indicators so that a system can build on its successes and at the same time improve where that is needed.”


PARCA Director Jim Williams Retires, Search for New Director Begins

Jim Williams, who has served as PARCA’s executive director since its founding, plans to step down from that position later this year after 27 years of dedicated service. PARCA’s Board of Directors has begun a search for a successor.

 
Williams’ career in public policy research has spanned 43 years. He was recruited by Governor Albert Brewer and Dr. Tom Corts in 1988 to lead PARCA.  Throughout his tenure, Williams has been the cornerstone of the organization’s unmatched reputation for providing objective information and advocating for efficient, effective, transparent and accountable Alabama government.

“We like to think of ourselves as a good government think tank. We provide research that people and political leaders can use to improve public policy and government operations,” Williams said.

While at PARCA, Williams has guided such initiatives as the Alabama SMART Budgeting program and Alabama Student Test Score Analyses. PARCA regularly publishes research on taxes and spending, on state, county and local governments and on public school finances and operations. The staff has won eight national awards given by the Governmental Research Association for research quality.

In 2008, Williams was named as one of the “40 Most Influential Non-Elected Alabamians” in Thicket Magazine, asserting that he “has become one of the most influential policy people in the state. He has the ear of many in Alabama.”

With the announcement of Williams' retirement, the search has begun for PARCA's new Executive Director.

McKinney Capital is supporting PARCA by providing a Talent Acquisition team to guide PARCA's search for a new executive director.  The job posting can be viewed here. The search committee is focused on finding someone with the leadership skills and track record of impact to advance PARCA’s mission of improving government for the people of Alabama.