
Alabama’s population looks noticeably different than it did in 2010, but its electorate has changed more slowly, and in different ways. Over the past 15 years, the state’s Hispanic and Asian populations have grown far faster than Alabama as a whole, its share of residents 65 or older has jumped from 13.8% to 19.4%, and its growth has concentrated in suburban and smaller metro counties while many rural counties have stagnated or declined.1
Those changes are reaching the electorate unevenly. For example, the Census Bureau estimates that 6.5% of Alabama residents are Hispanic, but according to the Alabama Secretary of State’s office, less than 2% of active registered voters are Hispanic. Many members of Alabama’s fastest-growing populations are too young to vote, not yet citizens, or not registered, so the state’s electorate has diversified more slowly than its population.
By contrast, the aging of the state’s population is magnified at the polls. Older Alabamians register at far higher rates than younger Alabamians. And the share of votes coming from rural counties continues to decline, as population continues to shift toward suburban and smaller metro counties, counties that are receiving a disproportionate share of population growth.
The following analysis examines how race, age, and geography have reshaped Alabama’s electorate and what those changes mean for the November 3 midterms and beyond.
Race
Between 2010 and 2020, Alabama’s population climbed from 4,779,736 to 5,024,279. That 5.1% gain, which ranked 27th among all states, was produced by modest domestic and international migration and a low rate of natural increase.
Over the same time period, the Black share of Alabama’s population held steady while the white non-Hispanic share declined. In 2010, the state was 67.0% white and 26.0% Black; ten years later, it was 63.1% white and 25.6% Black. The white population declined by 33,051 people (-1.0%), while the Black population grew by 43,722 people (3.5%).
Alabama saw more significant gains in its Asian and Hispanic populations, which grew at more than eight times the state’s overall rate. The Asian population added 22,981 people, and the Hispanic population added 78,445 people, the most of any group except multiracial Alabamians, whose increase largely reflects changes in how the 2020 census recorded race.
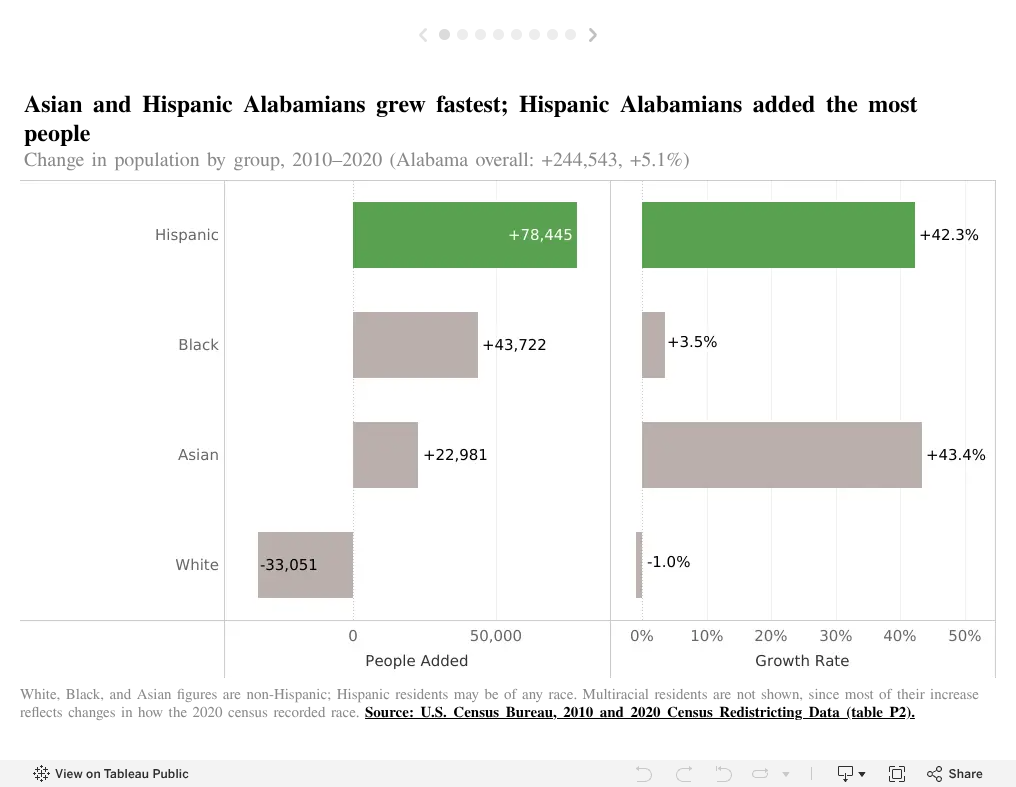
Census Bureau estimates suggest the growth has continued into the 2020s. Alabama’s Hispanic population grew by about 27% between 2020 and mid-2025, and its Asian population grew by about 16%, compared with 3.4% for the state as a whole. As of 2025, Hispanic residents made up 6.5% of Alabama’s population, and Asian residents 1.7%.
But Alabama’s electorate has not diversified as quickly as its population. According to American Community Survey (ACS) estimates for 2020 to 2024, nearly all of the state’s white and Black residents are U.S. citizens, and between 75-81% are age 18 or older. Similarly, 79.9% of Asians are adult and voting age. However, only 51.3% of Asian Alabamians are adult citizens.
In a more glaring contrast, only 61.2% of Hispanic Alabamians are 18 or older, and only 37.6% are adult citizens.

Even among Hispanic Alabamians who are eligible to vote, relatively few register. In 2024, only 30.4% of Alabama’s Hispanic American citizens 18 and older reported being registered to vote, according to the Census Bureau’s Current Population Survey (CPS).
By contrast, 70.9% of white citizens, 67.7% of Black citizens, and 65.9% of Asian citizens in Alabama reported being registered. The sample size in the survey was small for Asians and Hispanics, leading to uncertainty about exact percentages. Even at the upper range, however, the Hispanic registration rates would be far lower than for white and Black Alabamians.
Registration data from the Alabama Secretary of State tells a similar story. As of September 2026, 70.0% of Alabama’s active registered voters were white, 25.8% were Black, 1.7% were Hispanic, and 0.8% were Asian. While those figures use different racial categories than the census and are not directly comparable, they point in the same direction: Hispanic and Asian Alabamians make up a far smaller share of registered voters than of the state’s population.

Nevertheless, Hispanic Alabamians remain poised to become a larger share of the state’s electorate as their children come of age: according to the same ACS estimates, nearly 4 in 10 Hispanic Alabamians are under 18, and more than 90% of those children are U.S. citizens. How much that growth shows up in elections will depend on whether they register at higher rates than today’s eligible Hispanic adults.
Age
But while Alabama’s Hispanic population is young, the state as a whole is growing older. In 2010, 13.8% of Alabamians were 65 or older. By mid-2025, according to Census Bureau estimates, that share had risen to 19.4%. That compares with 21.5% of residents who are under 18. As a consequence, there are almost as many adults 65 or older as there are children in today’s Alabama.

Between 2010 and 2025, Alabama’s 65-and-older population grew by about 352,000, an increase of more than 50%, while its overall population grew by 8.6%.
As birth rates declined and more and more of the baby boom generation aged past 65, every younger age group shrank as a share of the state’s population, and Alabama’s median age rose from 37.9 to 39.8.
The pipeline into the state’s oldest age group remains full: about 1.26 million Alabamians, roughly a quarter of the state’s population, are between 45 and 64, and the youngest baby boomers will turn 65 in 2029. Projections by the University of Virginia’s Weldon Cooper Center suggest the share of Alabamians 65 and older will continue to increase through the end of the decade.
Older Alabamians are also far more likely to register to vote than younger ones. In 2024, 77.5% of Alabama citizens 65 and older reported being registered, compared with 53.0% of those 18 to 24, according to the Current Population Survey.

Alabama’s oldest residents are the only age group gaining ground as a share of the population, and among the most reliably registered. Their influence at the polls will likely keep growing through at least the end of the decade.
Geography
Just as Alabama’s adult population has aged, it has also physically shifted. The state’s four largest population centers, Birmingham, Huntsville, Mobile, and Montgomery, have remained the same since 1960, but the balance among them has changed since 2010, and a smaller share of Alabama’s adults now live in rural counties.
Between 2010 and 2020, the voting-age population of Madison County grew by 19.1%, and Tuscaloosa County, home to the state’s fifth-most populous city, grew by 17.1%, outpacing the state’s 7.4% growth. Jefferson (4.6%), Mobile (3.2%), and Montgomery (2.4%) counties all grew more slowly than Alabama as a whole. By 2020, Huntsville had passed Birmingham as the state’s most populous city.
The state’s fastest growth, however, came in suburban and smaller metro counties. Baldwin County’s voting-age population grew by 30.0%, the most of any Alabama county, followed by Limestone (26.7%), a suburban county of Huntsville, and Lee (25.6%), home to Auburn. Shelby County, a suburban county of Birmingham, grew by 17.5%, even as Jefferson County grew more slowly.
As a group, suburban and smaller metro counties grew by 13.2%, nearly twice the statewide rate, and accounted for more than half of Alabama’s growth in adults. Core counties grew by 8.1%, carried by Madison and Tuscaloosa.

Rural counties, meanwhile — home to nearly 30% of the state’s adults in 2010 — accounted for less than 2% of its growth. Every county that lost adult residents but one (Lawrence) was rural, and the steepest losses were concentrated in the Black Belt: Perry (-16.1%), Greene (-11.4%), and Dallas (-8.1%).

A PARCA analysis of Census Bureau estimates shows the pattern has continued. Between 2020 and mid-2025, the adult population of suburban and smaller metro counties grew by nearly 8%, almost twice the statewide rate of 4.1%, while core counties grew by 3.1% and rural counties by 1.0%. The Black Belt’s adult population fell by nearly 6%.
Those population shifts have changed where Alabama’s votes come from. According to a PARCA analysis of county-level presidential results compiled by the MIT Election Data and Science Lab, suburban and smaller metro counties cast 31.2% of the state’s presidential vote in 2012; by 2024, they cast 34.9%. Core counties’ share fell from 39.3% to 37.4%, and rural counties’ share fell from 29.4% to 27.8%. The Black Belt’s 12 counties cast 5.2% of Alabama’s votes in 2012 but 3.7% in 2024, although part of that decline likely reflects 2012’s unusually high Black turnout nationally, with Barack Obama on the ballot.
A PARCA analysis of county-level population projections by the University of Alabama’s Center for Business and Economic Research suggests the trend will continue for decades: between 2025 and 2050, the population of suburban and smaller metro counties is projected to grow by nearly 29%, compared with 8.7% for core counties, while rural counties are projected to barely grow and the Black Belt to lose a third of its residents.
What it means for November
Fewer people vote in midterms than in presidential elections: according to the Alabama Secretary of State, 38.6% of Alabama’s registered voters cast a ballot in 2022, compared with 58.5% in 2024.
Midterm voters are also older. Alabamians 45 and older cast 70.1% of the state’s votes in 2022, compared with 64.4% in 2024, while those 18 to 24 cast less than 5%, according to the Current Population Survey.

Taken together, the trends suggest November’s voters are likely to be older than the state’s adult population, and older still than those who turned out in 2024. More ballots will likely come from suburban and smaller metro counties and fewer from rural counties. And voters are likely to be far less diverse than Alabama itself, with Hispanic and Asian Alabamians, who make up only a small share of active registered voters, casting only a small share of votes.
Beyond this year, the electorate will keep aging through the end of the decade as the last baby boomers turn 65. At the same time, tens of thousands of young Hispanic Alabamians, nearly all of them U.S. citizens, will reach voting age, and the state’s growth will keep tilting toward its suburbs.
Notes
- Counties are classified using the Office of Management and Budget’s 2023 metropolitan area definitions. Core counties contain the principal city of a metro area with at least 250,000 residents. Rural counties are those the federal Office of Rural Health Policy classifies as fully rural: all non-metro counties, plus metro counties with no residents in an urban area of 50,000 or more. Suburban and smaller metro counties are all other metro counties. ↩