Alabama has record low unemployment, one of the lowest unemployment rates in the country.
And yet, the percentage of Alabamians actually working is lower than almost any other state.
This seeming paradox explains, in part, why Alabama has lower per capita income than most other states and higher rates of poverty, despite those historically low unemployment numbers. To be counted as unemployed, you have to be looking for work, or in other words, participating in the labor force.
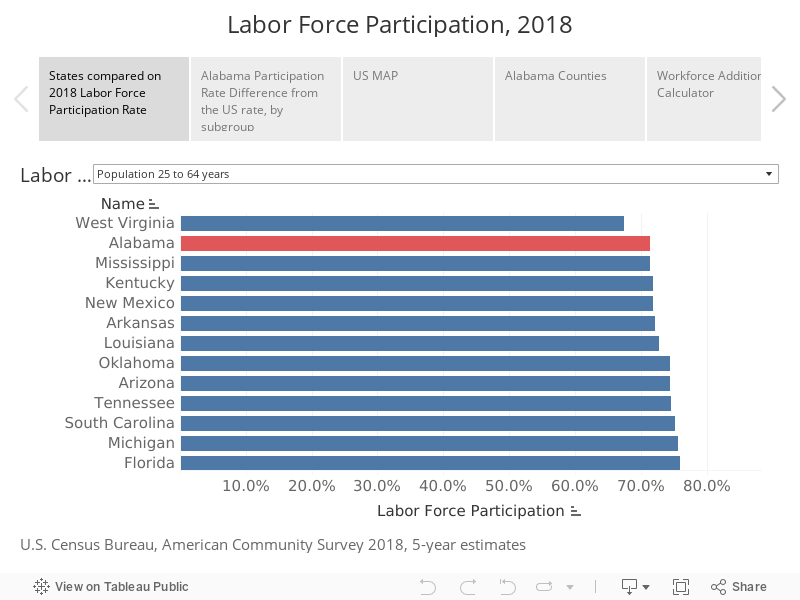
In 2018, Alabama’s labor force participation rate was lower than all other states, except West Virginia (we’re tied with Mississippi). As measured by the American Community Survey, 71% of Alabamians, ages 25-64, were working or looking for work. That compares to the U.S. labor force participation rate of 78% for that age group.
If Alabama’s labor force participation rate equaled that national average, Alabama would have almost 160,000 additional workers in the workforce in that age range.
Low labor force participation is a significant problem for Alabama, one that has been recognized by Gov. Kay Ivey’s Administration and the Alabama Workforce Council in its Success Plus Initiative (for more information on this initiative see Education Matters, a report from the Business Education Alliance authored by PARCA. You can also read the Alabama Workforce Council’s latest update on the effort).
Increasing the state’s labor force participation rate is one of the key objectives identified by Success Plus for helping Alabama meet its goal of adding 500,000 highly skilled workers to its workforce by 2025. The state will not reach that goal without bringing significant numbers of those who have dropped out of the workforce back in, which in most cases means equipping them with supplemental education and skills needed to thrive in today’s work environment.
Who is missing?
Before we can bring people back into the workforce, we have to understand who’s missing in the first place, and which groups of Alabamians have dropped out at a higher rate than residents of other states.
Using data from the U.S. Census Bureau’s American Community Survey (ACS) for 2018, PARCA examined the labor force participation in Alabama in comparison to other states and to the nation as a whole. We used five-year estimates because that survey provides estimates for smaller counties not present in the one-year estimates.
A comparison of one-year estimates yields similar results. However, it should be noted that in the 2018 one-year estimates, labor force participation in Alabama did show an increase over 2017, from 70.5% to 71.4%, after a multi-year downward drift. Whether that is a result or the economy or policy focus, it would be hard to determine, but, hopefully, it is part of a trend. For comparison, before the Great Recession, Alabama’s labor force participation rate was 75% for that age group and the national rate was 80%.
Sharpest differences with the rest of the U.S.: Age, Income, and Disability
Alabama trails the rest of the U.S. labor force participation rate across the board. When you break the population down into subgroups by age, sex, race, economic condition, or educational attainment, in almost every subgroup, Alabama’s rate trails the U.S. rate. However, in some subgroups, the divergence from the national rate is particularly sharp.
In comparison to the same population groups in other states, older Alabamians and Alabamians with lower levels of education are less likely to participate in the labor force, according to Census figures. Alabamians with a disability are also less likely to participate in the workforce than their counterparts in other states. The labor force participation rate for those groups is roughly 10% lower in Alabama than it is for similar individuals across the U.S.

The gap with the U.S is most extreme when it comes to individuals with less than a high school education. In Alabama, only 49% of individuals who lack a high school diploma are working or looking for work. That compares to a labor force participation rate of 61% nationally for those with less than a high school education.
Older workers in Alabama are also disproportionately out of the workforce. The labor force participation rate of those 60 to 64 is 10 percentage points lower in Alabama than it is in the rest of the country: 46% of Alabamians ages 60-64 participate in the labor force compared to 56% nationally. For those between 55-59, Alabama’s labor force participation rate is 63% compared to 72% nationally.
Age remains a factor in those between the ages of 45 and 54; Alabama’s rate is almost 7 percentage points lower than the U.S. average. For those 44 and younger, the gap between the Alabama workforce participation rate is narrower, though Alabama’s rate is still 3 to 4 percentage points lower than the U.S. rate.
You find a similar pattern with educational credentials: the more education an Alabamian has, the more likely he or she is to participate in the workforce. As the education level rises, the gap with the U.S. rate closes: 84% of Alabamians with a bachelor’s degree or higher participate in the workforce compared to 86% nationally.
When it comes to individuals who report having a disability, Alabama also has lower rates of labor force participation than other states, with the labor force participation rate among disabled individuals in Alabama trailing the national average by 9%.
You can explore state and national rates of workforce participation in the map below. Use the selector at the top to choose the population group to measure.

The impact of Alabama’s labor force participation deficit in these subgroups is amplified because Alabama’s population is older, less educated, and more disabled than the country as a whole. Alabama’s median age is 38.7 compared to 37.8 in the US; 25% of Alabamians have a 4-year degree compared to 32% across the country; 11.6% of Alabama’s population reported a disability compared to 8.6% nationwide.
What does not impact our labor force participation rate
Alabama’s racial diversity does not affect the state’s labor force participation rate, though if Alabama was more diverse, our labor force participation rate might be higher.
Non-Hispanic whites (ages 16 and up) have the lowest labor force participation rate of the major racial and ethnic groups, just under 57%, lagging non-Hispanic whites nationally by 5.4 percentage points. Blacks in Alabama have a labor force participation rate of just over 57%, lagging the U.S. rate by 5.2 percentage points. Alabama Hispanics have a labor force participation rate of 67%, which is less than a percentage point difference from the U.S. labor force participation rate for Hispanics.
It is sometimes assumed that Alabama’s supposed preference for traditional gender roles might depress the labor force participation rate for females in Alabama compared to the rest of the U.S. However, if those attitudes produce any effect, it is slight. The female labor participation rate in Alabama is 66.4%, trailing the national average by 6.2 percentage points. That’s only slightly higher than the gap for males. The male labor force participation rate in Alabama, 76.6%, trails the U.S. rate by 5.6 percentage points. In fact, one subset of the female population in Alabama participates in the workforce at a higher rate than the U.S. rate. Alabama females with children under 6 are more likely to be in the workforce than similarly situated women nationwide. According to the Census figures, 71.4% of those mothers participate in the labor force.
Geography matters
Alabama’s rural counties have the lowest labor force participation rates. Meanwhile, the most urbanized and affluent of Alabama counties have the highest rates of labor force participation.

One might conclude that it would be best to recruit workers back into the workforce by targeting rural counties where labor force participation is lowest. However, this neglects the fact that the largest population of workers who aren’t participating in the workforce are in metropolitan counties. That’s also where unemployment is lowest and jobs are clustered. Both rural and metropolitan counties need strategies for increasing labor force participation.
The visualization below allows you to calculate how many additional workers could be added to the workforce in the selected geography if that geography matched the U.S. labor force participation rate for the selected subgroup. The two subgroups selectors on the dashboard, one for the subgroup population and one for the subgroup labor force participation rate must be set to the same subgroup to produce accurate calculations.
