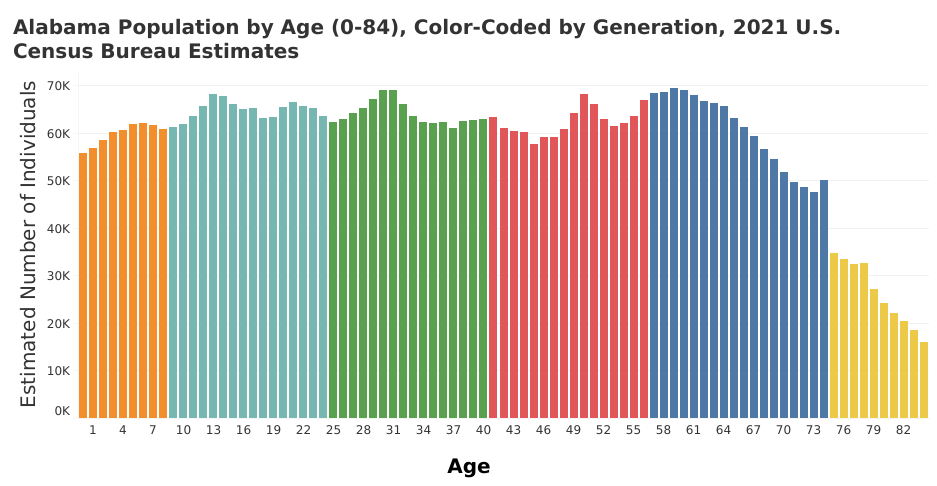
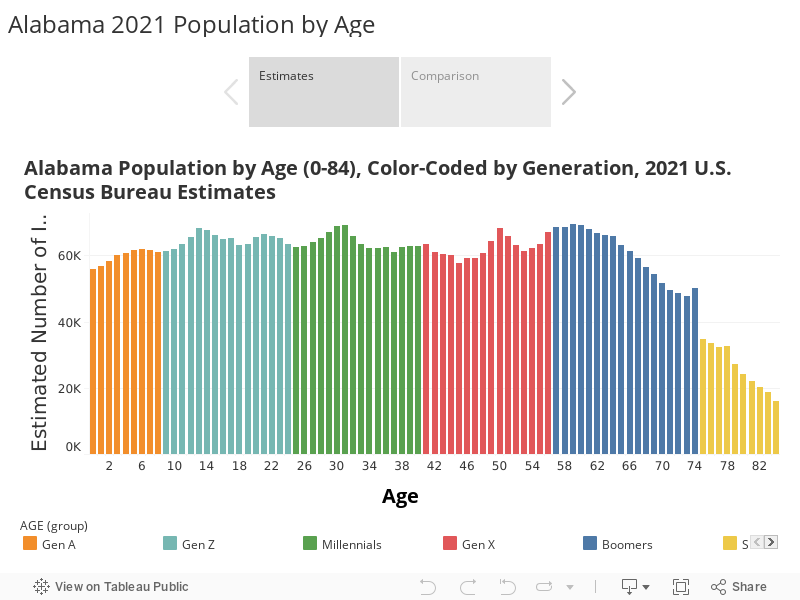
Absent immigration from other states or from abroad, Alabama’s working-age population is on track to shrink in coming years, according to a PARCA analysis of new population estimates from the U.S. Census Bureau.
(Not represented in the graphic are the more than 85,000 Alabamians the Census estimates included in the 85 and older category).
The 2021 Census population estimates by age provide a preview of the number of individuals that will join the workforce and the number that will likely be leaving it. Two factors are conspiring to create downward pressure on the working-age population:
Large numbers of aging Baby Boomers are likely leaving the workforce
The smaller rising generations, Gen Z and Gen A, will provide fewer replacements for those retiring workers.
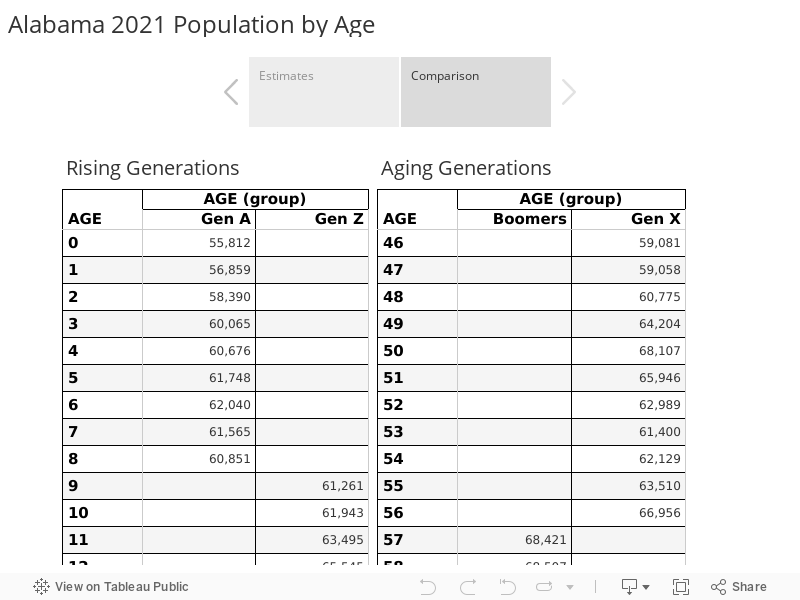
In 2021, the Census estimates there were 65,730 64-year-olds in Alabama vs. 63,125 18-year-olds, a difference of about 2,600.
In every successive year thereafter, the number of Boomers exceeds the corresponding Generation Z cohort.
The gap widens significantly when today’s 11 and 12 years reach the age of 18. In 2008, with the advent of the Great Recession, birth rates fell. And they haven’t recovered.
Even when the Baby Boom has moved out of the prime working years, the number of potential leavers will outnumber new entrants, based on the current age structure of the Alabama population.
Considering only the current population, over the next 18 years, Alabama’s population between the ages of 18 and 64 will drop by a cumulative total of more than 50,000.
However, current residents only make up part of the story. Population growth is also influenced by migration and birth and death rates. Labor force supply is also affected by migration, by labor force participation, and indirectly by educational and skills attainment.
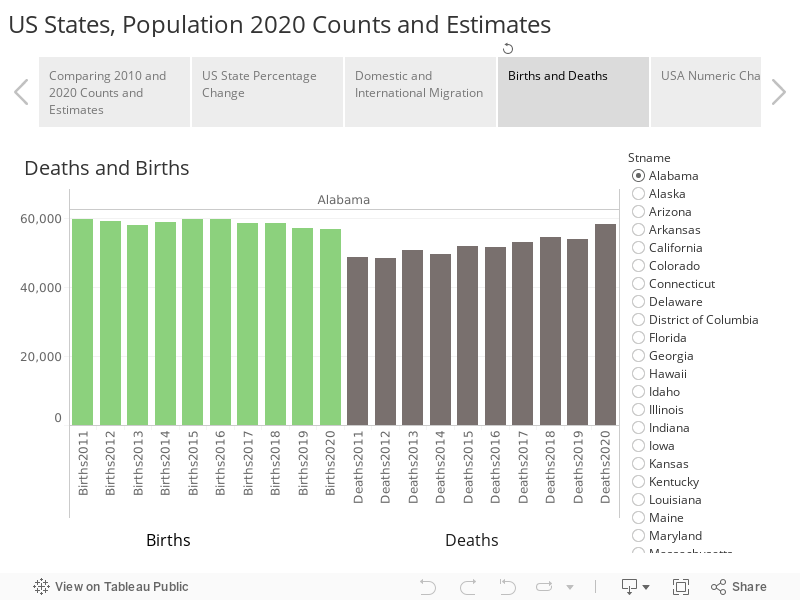
In terms of the natural population increase, Alabama has already seen two successive years in which deaths exceeded births. In 2021, about 8,500 more people died than were born, according to the estimates. This is due to the larger number of people moving into old age and the elevated death rates associated with the Covid-19 pandemic.
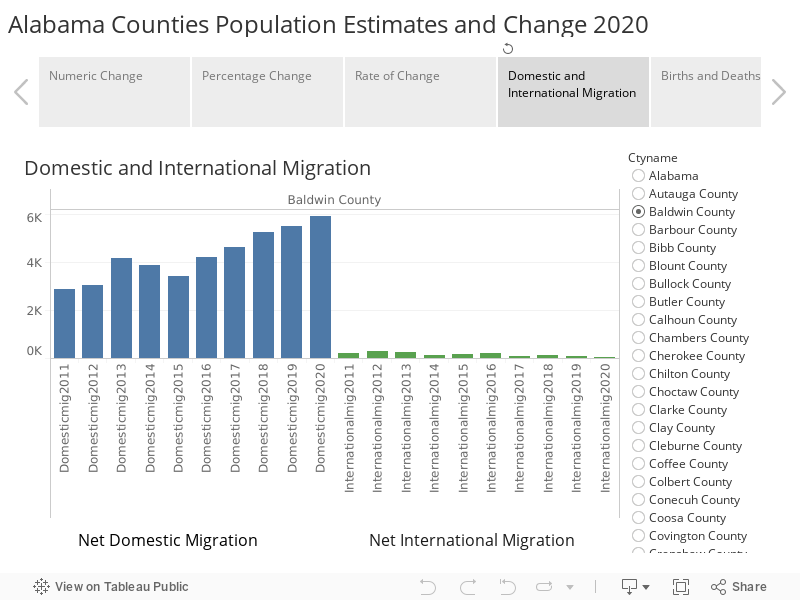
In terms of migration, changing patterns are affecting population and labor supply. From 2010-2016, most of Alabama’s population growth came through international immigration, with the state annually adding about 10,000 new residents who had been born abroad.
Since 2018, international migration has dropped, but domestic migration has increased.
In recent years, Alabama has enjoyed a net positive inflow of residents from other states, about 20,000 new residents a year from that source.
With unemployment low and demand for workers high, Alabama may continue to attract new residents through migration. But at the same time, the state is trying to increase the quality and the quantity of Alabama’s homegrown labor force:
By improving the education and training of the rising generation so that they are equipped for 21st-century jobs
By bringing Alabamians who’ve fallen out of the workforce back in
An array of state initiatives are underway to improve student preparation:
the expansion of First Class Pre-K
the Alabama Literacy Act
the expansion of Advanced Placement classes, high school/college dual enrollment, and the expansion of career technical education.
On the labor force participation front, through the Success Plus Initiative, the Alabama Workforce Council, the Governor’s Office, and an array of state agencies and participating nonprofits are collaborating on strategies to bring more people into the workforce training and education systems. The initiative seeks to address barriers individuals face to participating in the workforce and training. Through cooperation and outreach, the partners hope to reach discouraged workers and provide them pathways to high-demand fields.
The results are better than might be expected, considering the circumstances of the past three years. However, sustained effort will be required across multiple fronts to make competitive progress on educational attainment and labor force participation.
The Alabama Workforce Council and Gov. Kay Ivey launched the Success Plus initiative in 2018 amidst a national push to raise education and skill levels. Increasingly, a credential or degree beyond high school is considered essential to thrive in the modern economy. Higher levels of educational attainment for individuals and for the state are linked to higher pay, lower unemployment, and better health outcomes. Alabama trails other states in educational attainment and associated measures like labor force participation.
Between 2018-2021, Alabama produced 214,725 newly credentialed individuals between the ages of 16-64, according to estimates developed by the Center for Regional Economic Competitiveness, the Washington, D.C.-based nonprofit hired to analyze the state’s performance.
That includes associate’s and bachelor’s degrees earned at colleges, industry-recognized credentials in high schools, occupational licenses, and completed certification programs and apprenticeships in the adult population as well.
Refining the Goal
Like any thoughtful goal-setting exercise, Success Plus has refined its measures and goals. The original focus on the adult population (ages 25-64) has been broadened to include credential earners 16-24, recognizing that age group as the supply line for the future workforce and those most active in credential-earning.
Leaders of the initiative are also opting to focus on the numerical goal of 500,000 individuals rather than achieving a 60% rate of postsecondary credential attainment. A rate is more abstract and harder to measure. Beyond that, reaching the national average rate for educational attainment and labor force participation are important long-term goals but aren’t realistically attainable by 2025.
Refining the Count
To generate the counts and estimates, CREC worked across several information sources. Those estimates have limitations since they are based at least in part on aggregated data:
The data include reports from private for-profit and nonprofit schools and training agencies, some of which operate online distance education. Thus, some of the credentials reported by institutions with an Alabama presence may be earned by someone who lives elsewhere and won’t become part of the Alabama workforce.
The estimates can’t control for the quality of the credential earned.
Out-of-state students at Alabama public colleges earned about 40,000 of the 180,000 certificates and degrees included in the tally. Currently, only a small percentage of those students stay in Alabama.
Fortunately, a more precise count will eventually be available. The Success Plus initiative has spurred Alabama to build a privacy-protected system for tracking education, degree and credential attainment, and entry into the workforce, something most other states have already done.
That system is still developing, but its construction has already encouraged better data collection, standardization, and sharing across state agencies. That’s long been a need to generate timely insights on labor force and education supply and demand.
Success Plus is also building tools to sharpen the focus on quality credentials by building more direct routes through education to employment. The initiative brings together employers, educators, and outside experts to identify jobs that are in demand and the education and training needed to compete for those jobs successfully. As those pathways from education to employment become more clear, students should be able to plot a more efficient course to the career they want. And employers will be able to more efficiently identify individuals with the qualifications needed for positions.
Success Plus has identified those out-of-state students as an opportunity as well. A 2020 study by the Alabama Commission on Higher Education found that only 14% of bachelor’s degree earners who came from out-of-state were employed in Alabama five years after graduating. Alabama natives graduate and leave the state as well. The same study found that 62% of in-state bachelor’s earners remained in the state five years after graduation. Success Plus has energized efforts to retain those graduates as residents and workers.
Building momentum
Halfway to 2025, the number of career technical education credentials earned in high schools has risen, as has high school/college dual enrollment.
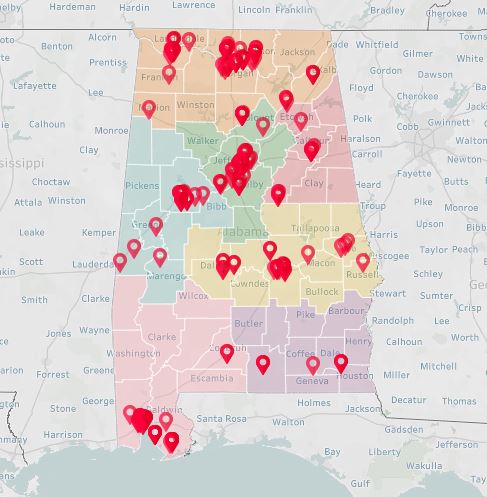
Another notable development spurred on by the Success Plus Initiative was the founding of the Alabama Office of Apprenticeship (AOA). In an apprenticeship, a new employee is paid while training and working for an employer or a profession. Apprenticeships often involve cooperation between an employer, a training provider, and the state, which encourages and helps subsidize paid training programs. Established in Sept. 2019, the AOA currently works with 427 employers, supporting 2,797 apprentices across the state.
Interactive Map of Apprenticeship Programs in Alabama
Needs Attention
The college-going rate for high school graduates has declined for several years and dropped sharply during the pandemic. Part of the reason for the long-term drop is the rise in the high school graduation rate, which had hovered in the 70s but now tops 90%. The numbers suggest that additional students are graduating from high school but lack the academic qualifications for college. It becomes all the more critical for those students to leave high school with a career-related credential or a pathway into training or employment.
Another factor in the drop was the pandemic, which hit two-year colleges particularly hard. Current enrollment suggests a rebound at those schools. The students who delayed starting college during the pandemic represent a target pool of prospects for recruitment to training or education programs.
For those that didn’t finish high school or have left the workforce, there are education and training programs available, but they are underutilized. Nick Moore, who heads the Governor’s Office of Education and Workforce Training, pointed out that Alabama received almost $50 million in Workforce Innovation and Opportunity Act (WIOA) funding in 2020 but only reached 8,000 participants. Less than half of those participants earned a credential through the program, and even fewer ended up in employment related to the training.
If Alabama is going to reach its attainment goals, agency partners will need to recruit more individuals into training that leads to in-demand jobs. Government agencies and nonprofit partners will need to collaborate around participating individuals. Partners can increase success rates by identifying and removing barriers that prevent participants from successfully rejoining the workforce.
Conclusion
Assuming sustained and sincere commitment, Success Plus could mark a turning point for Alabama by:
Bringing together a powerful array of interests and actors around a central goal, one that can only be achieved through action on multiple fronts.
Committing the state to systematically gathering, reporting on, and acting on data to determine what’s working and where there are problems in the education and workforce pipeline.
Prioritizing those who historically have been left behind: special populations that face barriers to educational attainment and participation in the workforce.
PARCA, in partnership with the Business Education Alliance and A+ Education Partnership, has tracked the progress of Success Plus since the initial goal was announced. The most recent report in the series, Forging Alabama’s Future, describes Success Plus and related initiatives and goals set by various partners.
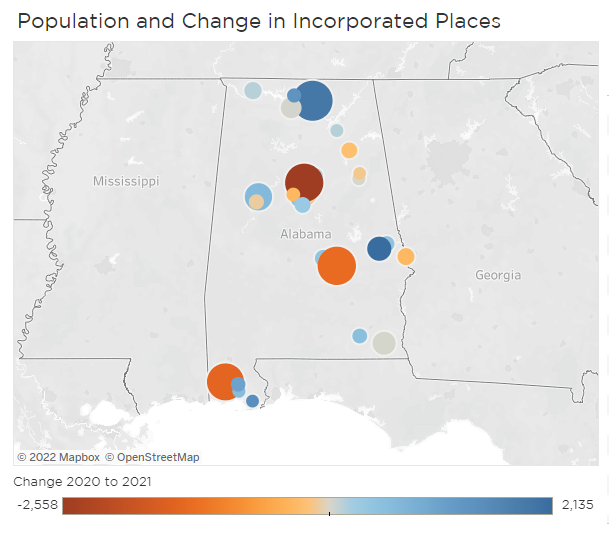
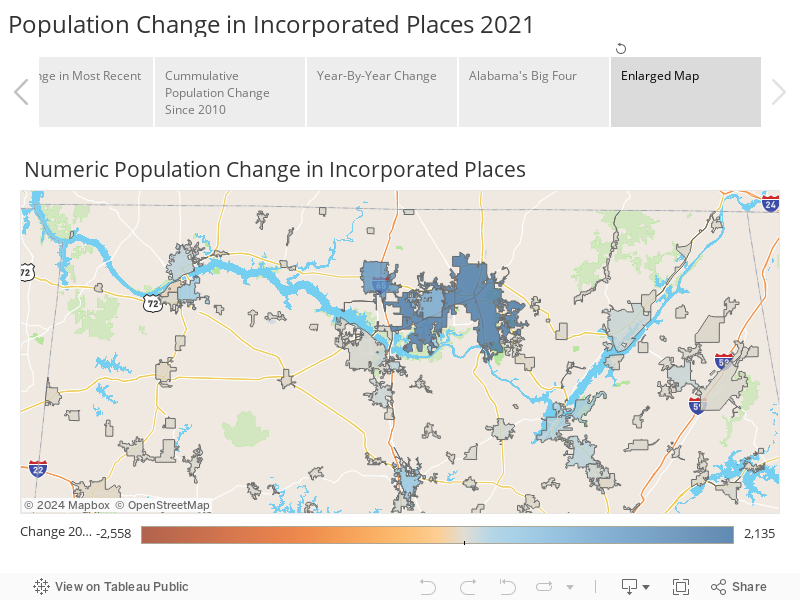
2021 Population Change in Alabama Cities
Each year, PARCA analyzes population estimates issued by the U.S. Census Bureau. Visualizations of the population estimates and change for the state, counties, and metro areas can be found on our data dashboard. The estimates release covers cities and towns and their population changes between July 1, 2020, and July 1, 2021. For additional perspective, see coverage of the estimates by al.com.
During this period, international migration was effectively shut off. The influx of new residents from overseas had been a primary driver of population gain in the larger established cities. Meanwhile, this period also saw elevated mortality rates due to the pandemic. Also, due to the pandemic, cities across the nation saw an outflow of residents as businesses stayed shuttered and workers were asked to work from home.
Birmingham’s population dropped by 2,558, more than any other Alabama city. It was followed by Mobile, which was down 1,459, and Montgomery down 1,341. With an estimated population of 197,575 in 2021, Birmingham is now the state’s third-largest city, behind Montgomery at 198,665, and No. 1 Huntsville, at 216,963.
Huntsville bucked the trend of large city population loss, adding 1,920 residents according to the estimates. Only Auburn added more, 2,135, which was more population gain than any other Alabama city. Since 2010, Auburn’s population has increased 43%, the fastest rate of growth among cities over 20,000. Neighboring Opelika has also grown, adding an estimated 465 in 2021.
Both Auburn and Huntsville have been spreading out through annexation, adding undeveloped land where housing is now being built. At 218 square miles, Huntsville is now far larger than Birmingham at 147 square miles.
Add up the growth totals in Baldwin County, and you’ll see why the coastal county is No. 1 in numeric growth among Alabama counties. The estimates show Foley adding nearly 1,500 residents, Daphne more than 1,000, and Fairhope and Gulf Shores over 500 apiece.
The Birmingham-Hoover metropolitan area is still far larger than the next largest metro, Huntsville, with around 500,000 residents compared to Birmingham-Hoover’s 1.1 million. Over the past two decades, population growth around Birmingham has occurred chiefly in its suburbs.
However, according to the 2021 estimates, some traditional growth engines were idling. Trussville only added 172 new residents, and Hoover saw a net decrease of 98 residents. Homewood, Mountain Brook, and Vestavia Hills saw population declines. A bright spot for Jefferson County was Gardendale which posted a gain of 407. The growth in the Birmingham MSA occurred farther out in Shelby and St. Clair County. Calera added 742 residents; Chelsea, 478; and Helena, 465. Pell City, Moody, and Margaret town in St. Clair County also added residents. Nearby, Tuscaloosa added 658 residents and broke over the 100,000 population mark, coming in at 100,618.
Across a region, the biggest population gains were in north Alabama. In addition to Huntsville’s growth, Athens, in Limestone County, added over 1,300, and the City of Madison almost 1,000. Nearby, The Shoals added 424 residents, with growth in both Florence and Muscle Shoals continuing a positive trend. Across the entire northern tier of the state, almost all the cities and towns showed growth.
Southeast Alabama around Dothan saw modest growth, with Enterprise leading the way by adding over 500 new residents.
Anniston and Gadsden, however, continued a flat to declining population trend.
More broadly, most cities and towns in rural Alabama, from Northwest Alabama, through the Black Belt, and East Central Alabama, lost population.
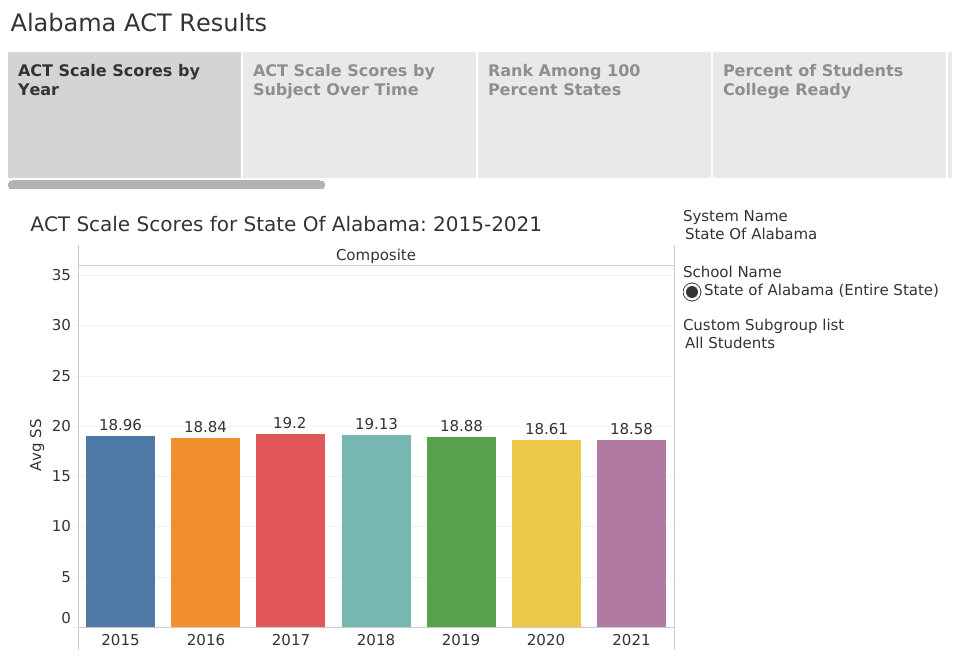
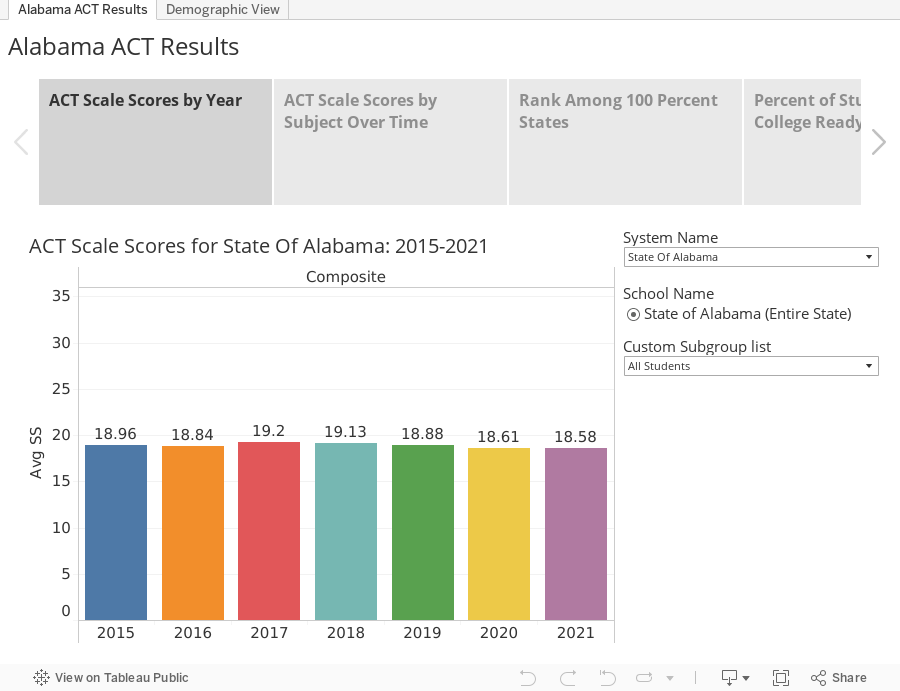
ACT Scores Down Only a Fraction For the Class of 2021, Despite Pandemic
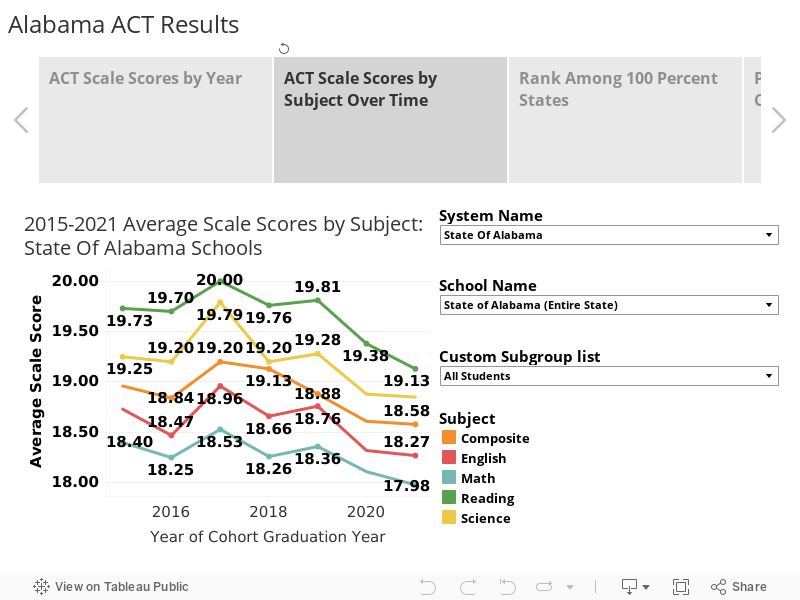
The average ACT score for students graduating from Alabama’s public high schools in 2021 was down only slightly, while the national average score fell more steeply, a fact that could be considered a victory in the light of the challenges faced by students and educators during the pandemic. Still, Alabama’s 2021 ACT results continue a downward drift from their peak in 2017.
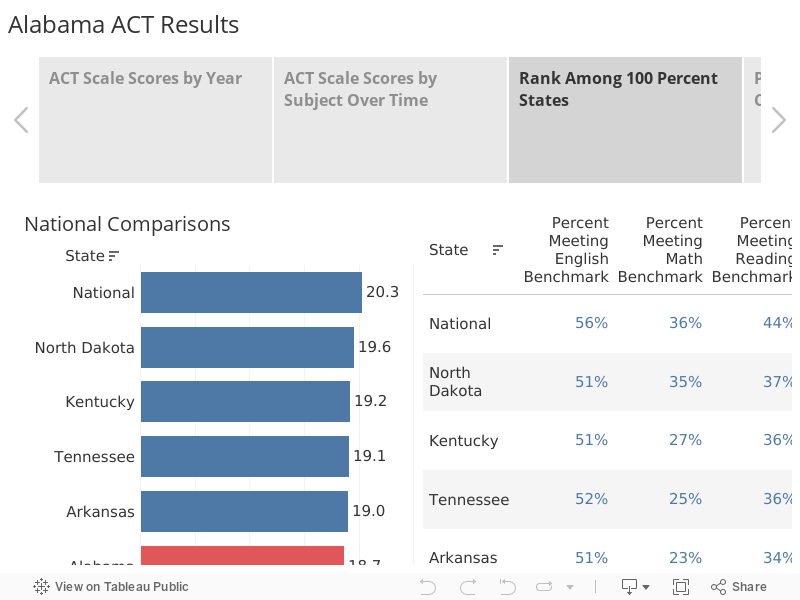
Alabama’s average score, 18.6 on a 36-point scale, shouldn’t be directly compared to the national average score. Alabama tests virtually all its public high school students, while only 35% of students take the ACT nationally. In states where the test is not universally given, only students planning to go to college take the test, which tends to push up the score. The national average score fell from 20.6 in 2020 to 20.3 in 2021. Among states that tested 100% of students, Alabama maintained its relative performance rank, behind Kentucky, Tennessee, and Arkansas but ahead of Mississippi and Louisiana.
Downward pressure on scores was expected. The pandemic led to the cancellation of several administrations of the ACT. Schools across the country operated virtually during the spring of 2020 when the students in the class of 2021 were juniors. Altered forms of schooling persisted into the fall of 2020. In normal circumstances, some students take the test more than once, attempting to boost their scores. That happened less with the Class of 2021. According to ACT, only 32% of students took the ACT more than once compared to 41% of the 2020 cohort. That drop was likely because most universities suspended the requirement of taking the ACT due to the disruptions.
In addition to the fractional drop in the average scale score for Alabama students, the percentage of students scoring college-ready in all subjects declined. In 2021, only 15% of students scored at or above the college-ready benchmark in all four tested subjects, compared to 16.3% in 2020 and 18% in 2017. According to ACT, students who meet a benchmark on the ACT have approximately a 50% chance of earning a B or better and approximately a 75% chance of making a C or better in a corresponding college course. ACT is primarily geared toward measuring readiness at four-year colleges and universities.
On each of the four subjects that ACT tests — English, math, reading, and science — student scores ticked down a fraction.
Some points of interest arise when delving more deeply into the numbers. Scores for white students declined in every subject while Black students held steady in reading and science. Hispanic students posted an improvement in English and science. Scores rose for both economically distressed and non-economically distressed students, an unexpected result considering that scores overall were down slightly. That may be explained by more students being classified as economically distressed due to the lingering economic consequences of the pandemic. Some students who had typically been in the non-economically distressed category likely shifted into the economically distressed pool, which can push up the scores of the economically distressed pool.
The stubborn score gaps between economic and demographic subpopulations persisted in 2021. Asians outperformed all other subgroups.
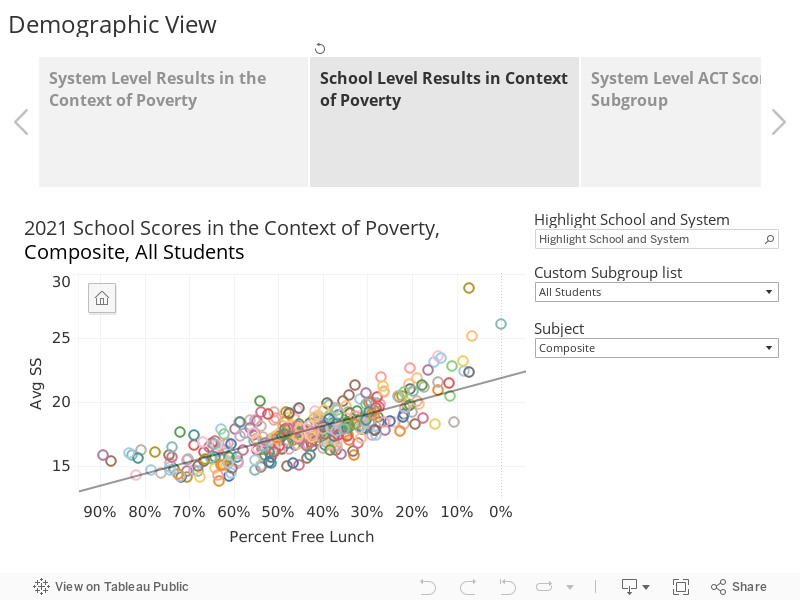
Due to the score gaps between students from different backgrounds, the demographic composition of the student body should be taken into account when evaluating a school or system’s performance. The scatterplot presents score performance in the context of the economic composition of the school system’s students.
Systems with a high percentage of non-poverty students are on the right of the scale, while schools with high poverty percentages are on the left. The higher the average scale score for the system, the higher the system appears on the graph. The line of prediction plots the expected performance level for a system considering the economic composition of the student body. Scores increase as the percentage of non-economically distressed students increase. Systems are grouped along that line of prediction, indicating a correlation between the average scale score in the system and the economic makeup.
Systems above the prediction line have outscored expectations based on economics.
A similar pattern can be seen in the array of individual high schools. However, there is more variation from the average. Taken together, the graphs tell us that the socioeconomic composition of a school influences the average score, but that systems and, to an even greater degree, individual schools do make a difference in student performance.
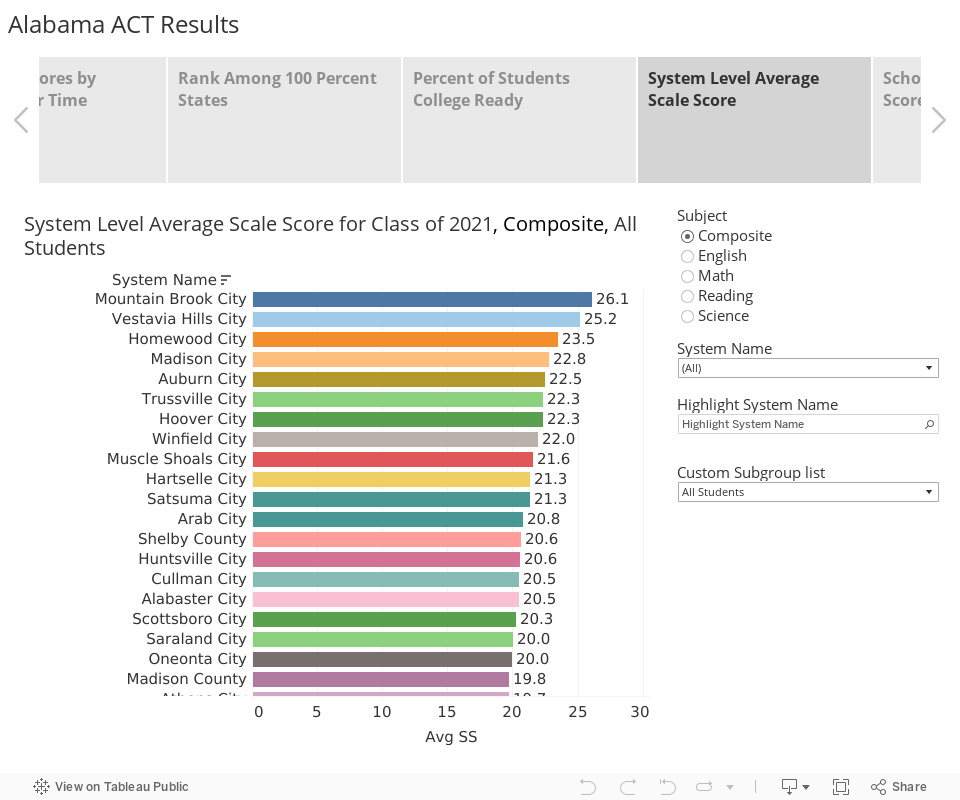
Bearing that in mind, PARCA’s visualizations of the 2021 ACT results allow the viewer to explore how their local schools and systems performed relative to others. Viewers can choose schools and systems that provide appropriate peer comparisons. In addition to comparisons by average scale score, additional views offer results by the percentage of students achieving the benchmarks in each subject. Lower poverty systems serving suburban communities tend to show the best results at the system level.
At the school level, the highest average performance is found not just among those suburban systems but also in magnet high schools in larger systems, like Montgomery County’s Loveless Academic Magnet Program (LAMP) and Huntsville’s New Century Technology High School.
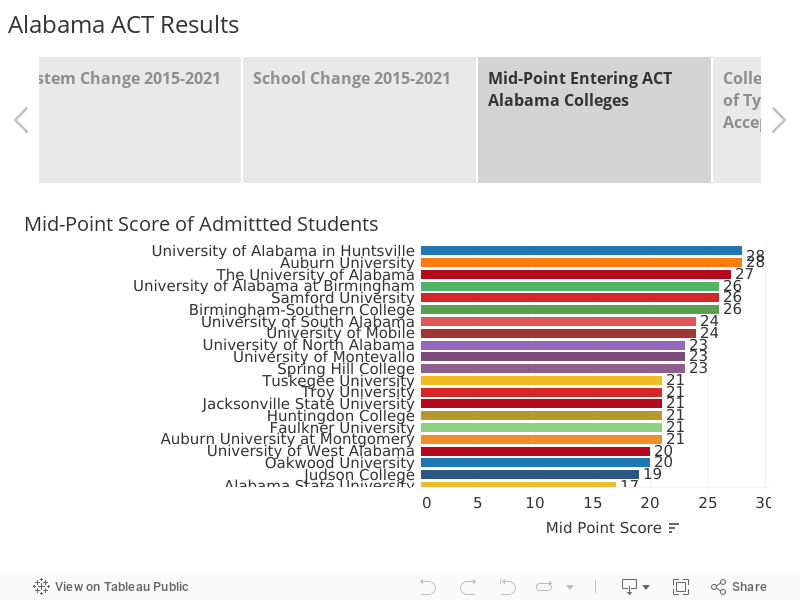
To put ACT scores in perspective, it is helpful to know the typical ACT scores for students entering college. Average scores range widely between colleges and within colleges. In Alabama, the mid-point ACT score for entering students ranges from 28 at the University of Alabama in Huntsville and Auburn University to 17 at Alabama A&M in Huntsville and Alabama State in Montgomery. As part of their mission, these historically-Black universities provide opportunity and access to students who may not have received the same level of college preparation. Many colleges have continued to waive the ACT requirement for admission and are instead relying on high school grades and other factors to assess student readiness. However, ACT scores can still play a role in admissions and in the competition for scholarships.
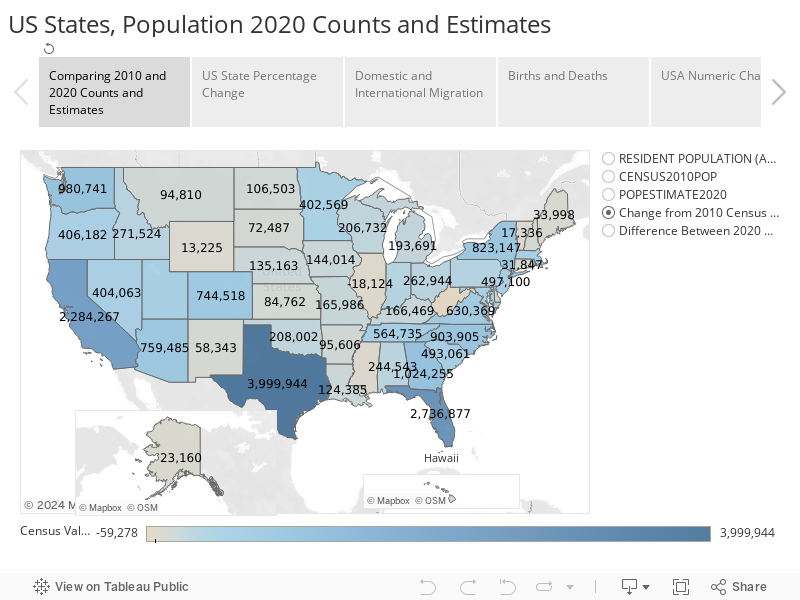
Deaths outnumber births, but population grows through domestic migration
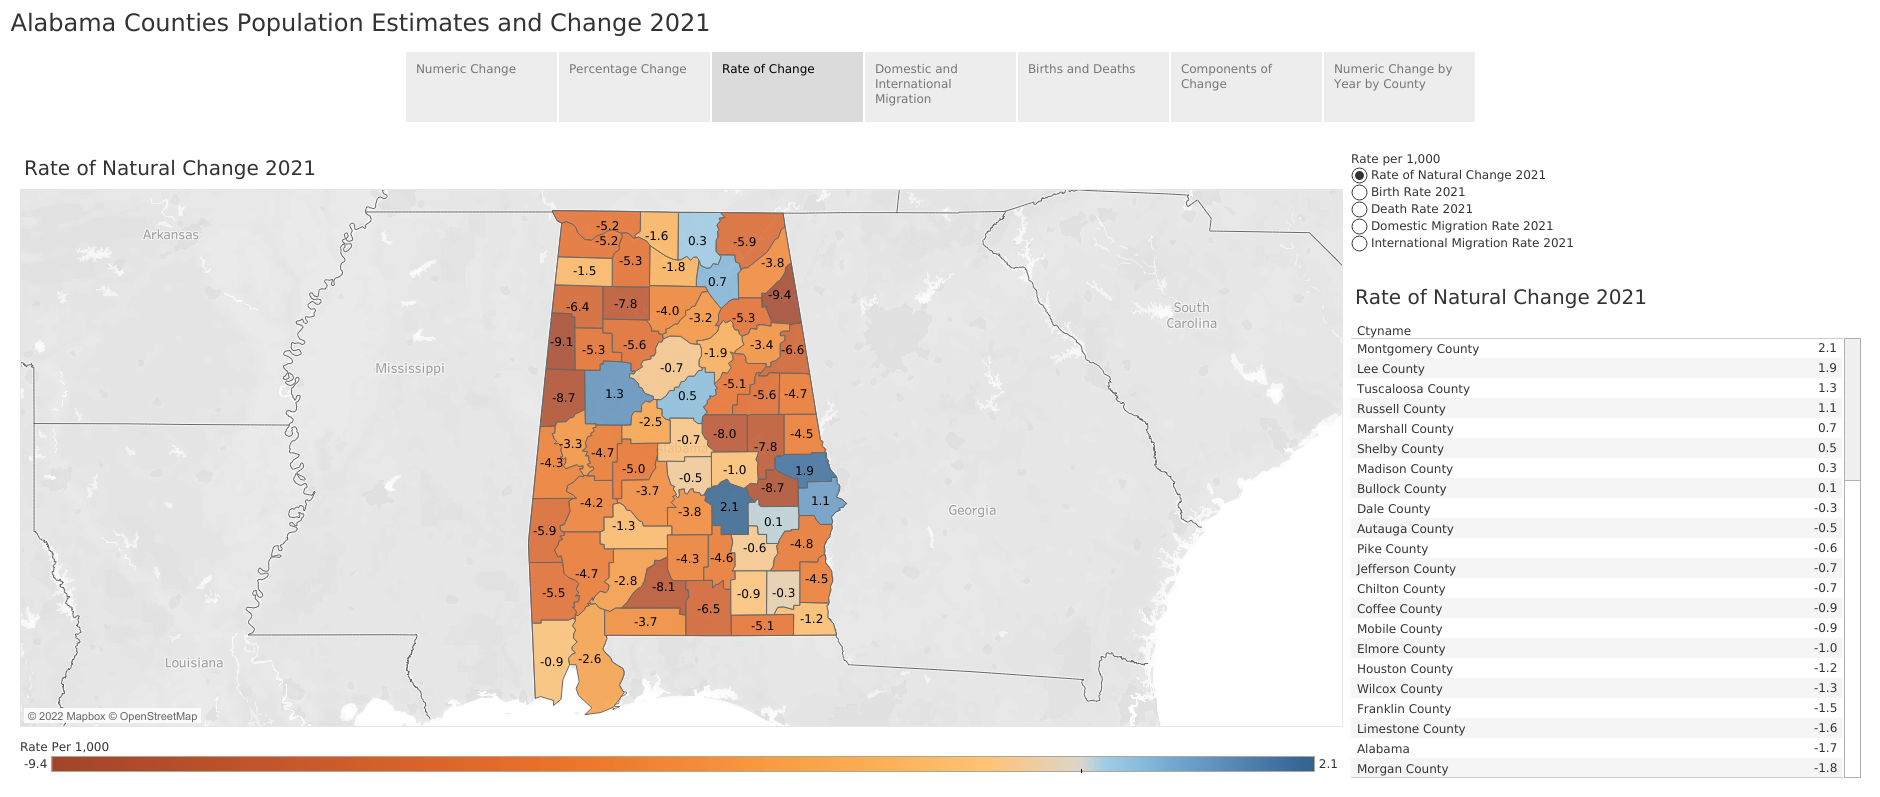
New estimates released by the U.S. Census Bureau show that more than half of Alabama counties lost population between July 1, 2020, and July 1, 2021, losses driven by an aging population, a declining birthrate, and an elevated death rate during the Covid-19 pandemic.
Statewide, the 65,868 deaths outnumbered 56,320 births, leading to a net loss through natural change of 8,548. In the visualization below, counties are shaded by their rate of natural change. Only eight counties, those in blue, saw more births than deaths. Alabama had the 4th highest death rate in the U.S., behind West Virginia, Mississippi, and Maine.
However, stronger growth through domestic migration (individuals moving from other states to Alabama, but excluding movers who are foreign-born) helped the state offset those losses. Estimates issued earlier this year put Alabama’s population at 5,039,877, up by about 15,000 or 0.3%, from 2020. A net total of 22,136 domestic migrants moved to Alabama, offsetting the loss from natural change.
Two counties accounted for about half that growth, with coastal Baldwin adding 6,780 net new residents through migration and Madison County adding 5,335. Madison County’s neighbor, Limestone, added 3,388. Other north Alabama counties like Cullman, Lauderdale, Jackson, Morgan, Marshall, and Dekalb also saw gains from domestic migration. The counties containing the three other large population centers — Jefferson, Mobile, and Montgomery — saw population declines, according to the estimates. Meanwhile, counties linked to those metro core counties — counties like Shelby and St. Clair, Elmore and Lee, and Baldwin — saw growth. Modest growth also occurred in some Wiregrass counties — Coffee, Houston, and Henry.
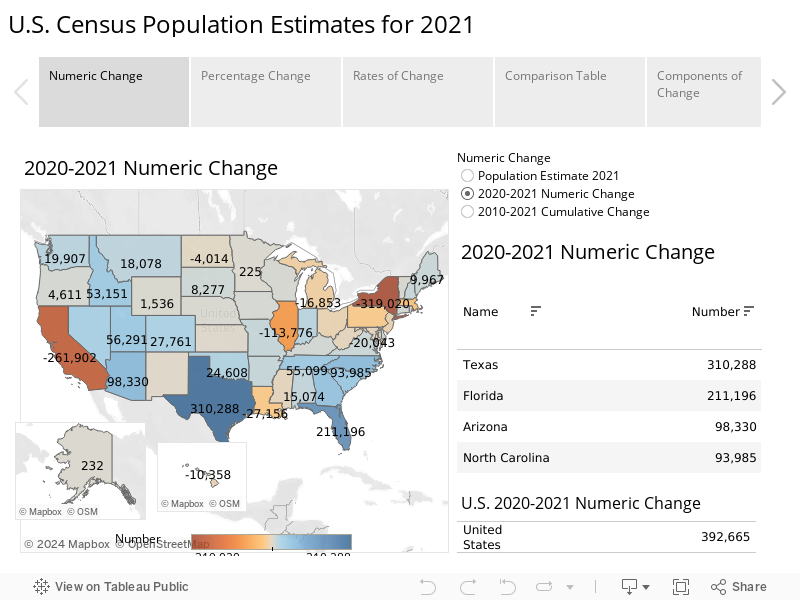
Zooming out to look at the Southeast, similar patterns are evident. Core counties in Atlanta, Charlotte, Nashville, and Memphis lost population while surrounding metro counties grew. Generally, growth was more widespread in Tennessee, Florida, the Carolinas, and the northern half of Georgia. Overall, Alabama counties bordering Georgia, Tennessee, and Florida are growing. Coastal counties on the Southeast’s East and Gulf coasts have seen growth. Counties along the interstates benefit throughout the region. Still, rural counties and whole swaths of the interior South, including counties in central and western Alabama, continue to lose population, not yet connected to the regional engines of growth.
When it comes to counties grouped into metropolitan statistical areas (MSAs), The Daphne-Fairhope-Foley, Huntsville, and Auburn-Opelika MSAs continue to show strong population growth. Among the 358 U.S. metros, they rank No. 16, 40, 50, respectively, in terms of percentage population change.
On the other hand, metro Birmingham is still not seeing the pace of growth of other Southeastern metros. Gains in Shelby, St. Clair, Bibb, and Blount counties weren’t enough to overcome Jefferson County’s estimated population loss of 5,521. Over the past decade, Jefferson County’s natural increase plus population gains from international immigration offset a steady stream of domestic outmigration. But in 2021, deaths outnumbered births by 438, and international migration accounted for a gain of only 153 people. Meanwhile, the estimates show a net loss of 5,238 domestic residents moving out of Jefferson. That produced a net population loss for the MSA in 2021. The Birmingham-Hoover metropolitan statistical area ranked 258 out of 358 U.S. metros in percentage change.
Montgomery ranked No. 248, with a slight population gain, and the Mobile MSA ranked No. 305, with a population loss of 1,326. After strong growth over the past decade, Tuscaloosa County and its metro area lost population in 2021, according to the estimate. Its growth rank ranked it No. 284 among U.S. metros.
The Auburn-Opelika MSA added 2,617 residents, according to the estimates, a growth rate of 1.5%. Dothan, Decatur, and the Florence-Muscle Shoals MSAs also showed positive growth. The Anniston and Gadsden MSAs continued to post slight declines.
Using the menus and tabs in the visualizations above, you can explore birth and death rates, numerical and percentage change of counties and MSAs in Alabama and across the U.S. The state population estimates and components of change released earlier this year are below.
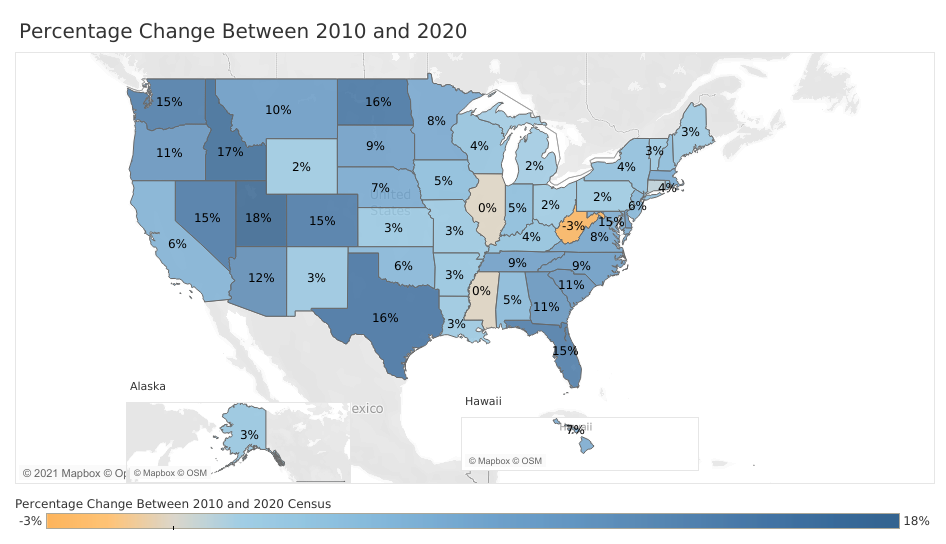
And the final visualization looks back to the results of the 2020 Census and compares population counts from April 2020 and April 2010.
New Business Education Alliance Report Calls for Historic Investments in Education and Workforce
The recovery from the pandemic presents an opportunity for Alabama to regain momentum by investing in proven strategies for improving reading, math, and college & career readiness argues a new report commissioned by the Business Education Alliance, a non-profit formed to unite business and education around shared priorities. The Public Affairs Research Council conducted research for the report, Forging Alabama’s Future: Improving Educational Attainment and Workforce Development.
“Alabama must do more to help students prepare for success after high school graduation,” said former State Superintendent Joe Morton, the chairman and president of the Business Education Alliance of Alabama.”
The pandemic led to a drop in college-going and a slowdown in the number of students graduating with career-ready credentials. Alabama has set a goal of raising levels of educational attainment since higher levels of educational attainment lead to higher earnings and higher rates of workforce participation.
Despite low unemployment and high demand for workers, the percentage of Alabama’s population working lags behind other states. “If the state’s labor participation rates were on par with the national average,” Morton said, “not only would more Alabamians be working, but wages would be increasing, poverty would be going down, and businesses currently struggling to find help would be more likely to have the support needed to thrive. But, to meet this target, Alabama must work harder and smarter than our neighboring states.”
The report describes the mutually reinforcing goals and strategies set by the governor, the state Department of Education, and the Alabama Workforce Council. Those goals include reaching the national average on the National Assessment of Educational Progress (NAEP) in both reading and math by 2026. Alabama’s strategies for meeting those goals will be the focus of PARCA’s Annual Forum, March 11, 2022. The program features national and state experts, Alabama Superintendent Eric Mackey, Mississippi’s Superintendent Carey Wright, and Gov. Kay Ivey.
“PARCA believes that setting goals, implementing and sustaining research-based strategies, and assessing progress toward those goals is the pathway to improvement,” said Ryan Hankins, the executive director of the Public Affairs Research Council of Alabama. “Our students and teachers succeed when we set high expectations and sustain the resources necessary to achieve them. The interdependent initiatives described in this report will require patience, commitment, and the courage to change. But we’ll all benefit from their success.”
Fewer Freshmen Assigned to Remedial Education
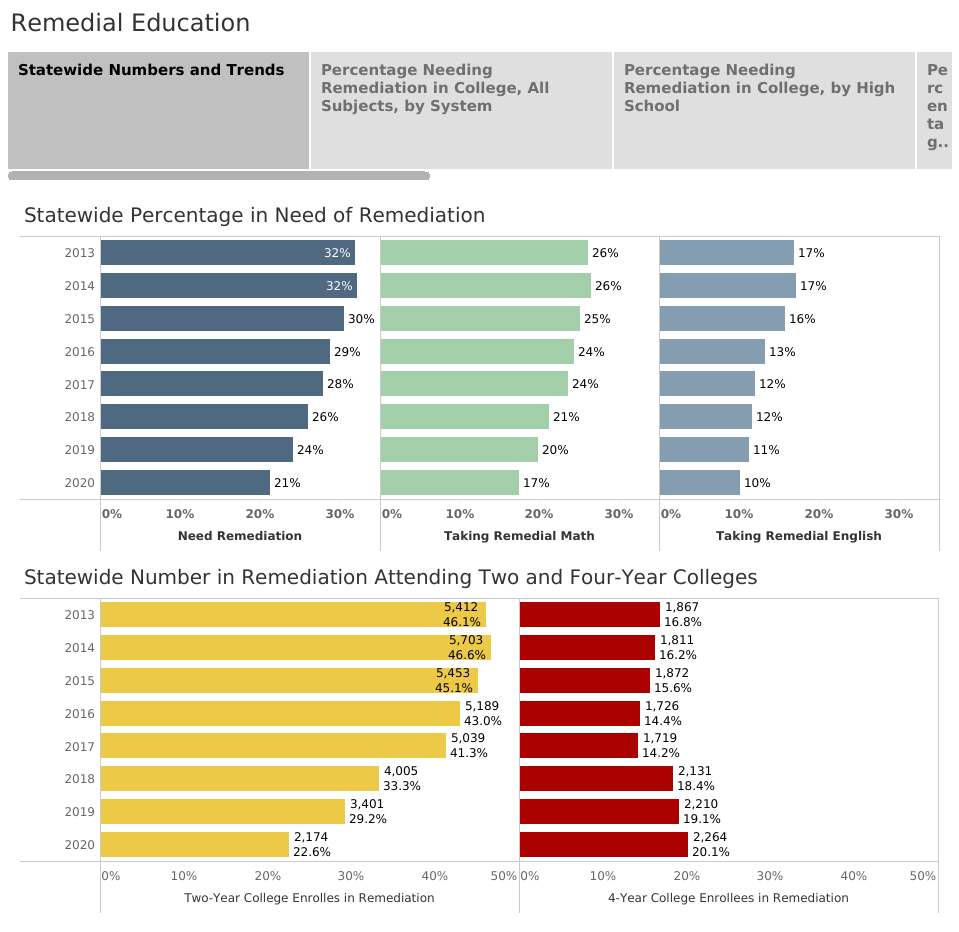
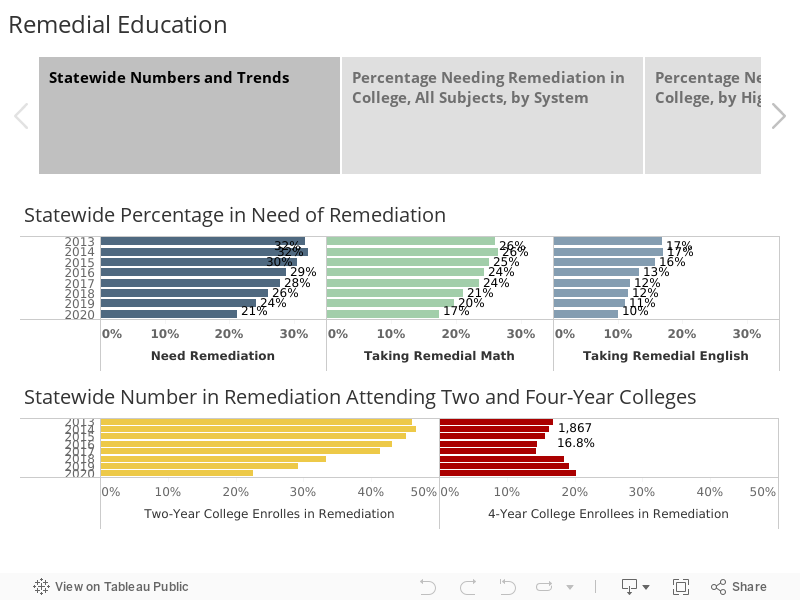
Despite the disruptions of the pandemic, Alabama high school graduates who entered college in 2020 were less likely to be assigned to remedial education and thus should be in a better position to succeed in college. The new figures released by the Alabama Commission on Higher Education (ACHE) show a continued decline in the number and percentage of students taking remedial classes in their first year, particularly among those entering community college.
Some of the declines might be attributable to fewer students going to college after high school. Only 54% of the Class of 2020 went on to college in the year after graduating high school, down from college-going rates above 60% in recent history. However, because the remediation rate among those who went to college was down and the decline in rate was concentrated at community colleges, the numbers indicate that the new approach to remedial education instituted by the two-year college system is working.
Remedial classes are non-credit college courses covering material students should have learned in high school. A student taking a remedial class is paying for a course that won’t count toward a degree. Low-income students can use Pell grants to help pay for the courses, but that can also lead to an exhaustion of Pell eligibility before degree completion. That extra cost and delay in progress are known to lower completion rates for students assigned to remedial education. High schools have been urged to improve preparation for college-bound students, which may account for some of the improvement over time. Still, since much of the drop has been in community colleges, the success in recent years points toward innovations in policy at the two-year schools.
Community Colleges Providing Alternatives
Alabama’s Community College System (ACCS) alternative to remediation has not only decreased the number of students being placed in remedial courses, but the colleges have also seen a rise in passage rates in their college-level math and English classes.
In 2018, The Alabama Community College System (ACCS) made system-wide changes designed to reduce the number of students enrolled in remedial courses (also known as developmental courses). Students were still assessed for their levels of academic preparation upon enrollment, but instead of being assigned to either regular or remedial courses, the system created other options. Students who needed extra support could be placed in a tutorial course alongside college-level math or English. Since the change, the number of students in remedial classes has declined, but the percentage of students passing gateway English and math has increased.
Meanwhile, the number of students assigned to remedial courses at four-year colleges has increased modestly. For years, the bulk of remedial education took place in the community college system. Now the number of students taking remedial classes is about equally divided between two and four-year schools. More students are assigned to remediation in math than in English, though the gap has narrowed as both rates have declined.
The report data from ACHE provides feedback to high schools about how prepared their graduates are. Use the tabs and arrows in the visualization to explore the data. Compare the performance of graduates from your local high school or system to other systems or schools.
This remediation data is the final dataset that looks back on students who graduated in the Spring of 2020. For that school year, PARCA previously published analyses of performance on ACT and WorkKeys, graduation and college and career readiness, and on college-going.
Progress Toward an Educational Goal
Decreasing the number of Alabama public high school graduates needing remediation in college was a goal identified in Alabama’s strategic plan for education, Plan 2020, adopted in 2012.
Remedial education is considered a waste of money for both the state and the individuals paying for higher education. Remedial courses cover material that should be learned in high school. Remedial classes cost students tuition and fees but do not produce credits that count toward graduation. By avoiding remedial courses, students can complete college work more quickly and at less cost.
Are entering college students better prepared?
Since 2012, Alabama has pursued multiple strategies to improve K-12 education and produce high school graduates better prepared for college and careers.
Most directly tied to college preparation, the state has increased support for dual enrollment, which allows high school students to take courses at colleges, and for Advanced Placement courses, college-level courses taught by high school faculty members.
Despite those efforts, scores for Alabama high school graduates on the ACT, the college-readiness test given to all students, have been flat to slightly declining. And while the number of students assigned to remediation has decreased in the two-year system, as noted, the number of remedial students has risen at four-year colleges.
Conclusion
Remediation is needed for students enrolling with a major gap in their readiness for college. Given the open admissions policy in the two-year system and for some four-year colleges, remedial courses continue to play a role in higher education. For others who need some help rising to the level of college coursework, it benefits students and schools to provide alternatives to remediation. The most straightforward solution is to improve preparation in high school, and those efforts should continue. The two-year system’s strategy to provide simultaneous tutoring rather than sequential remedial courses appears to benefit students, increasing passing and progression rates. The model ACCS has developed should also be explored for replication at four-year colleges.
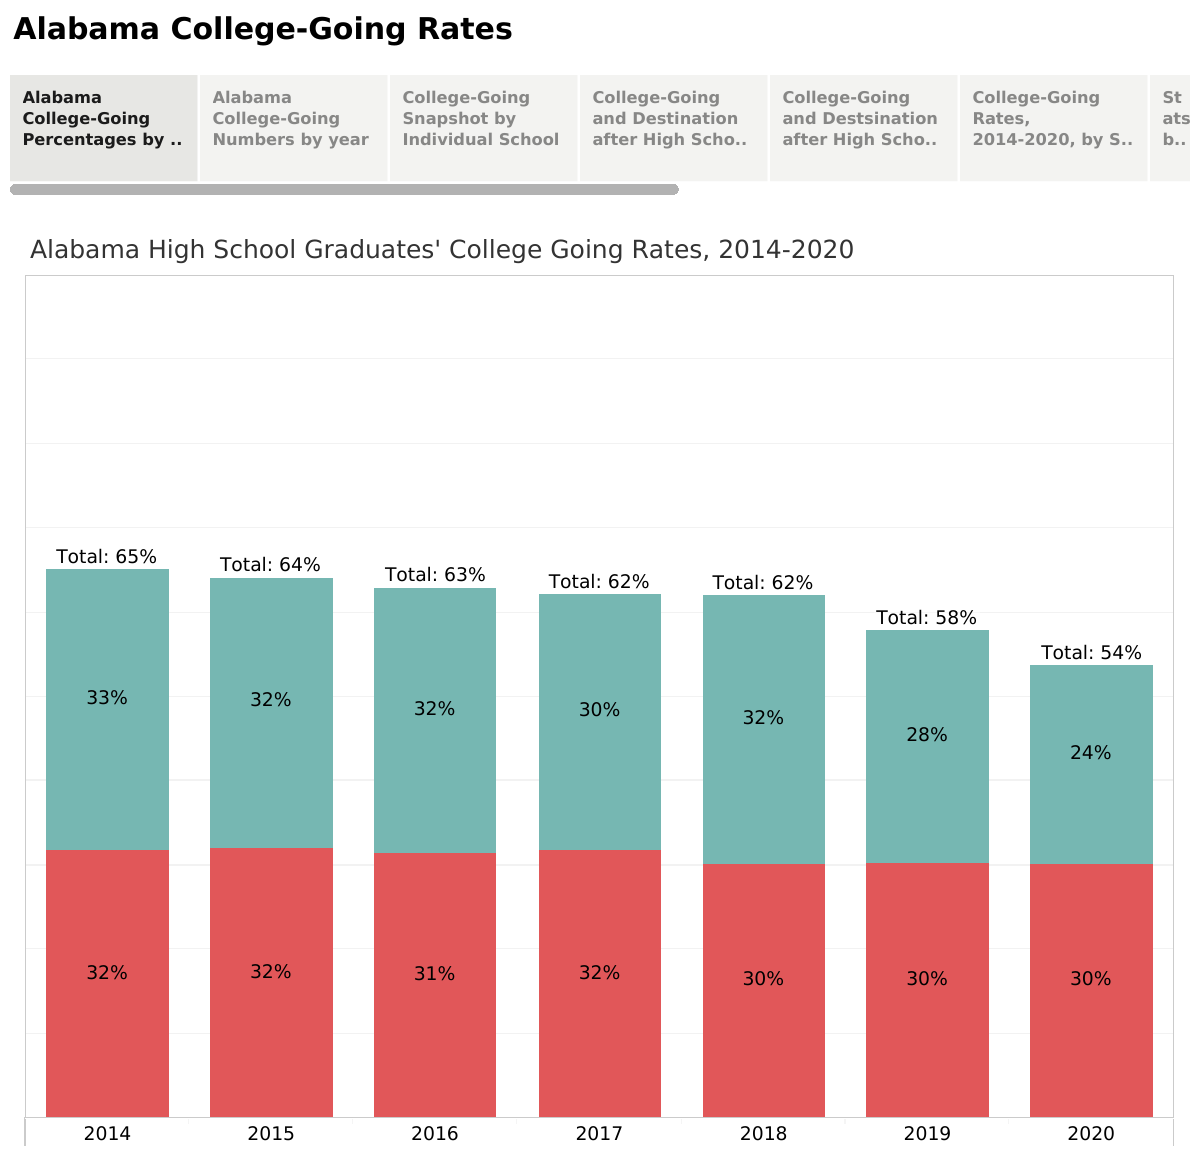
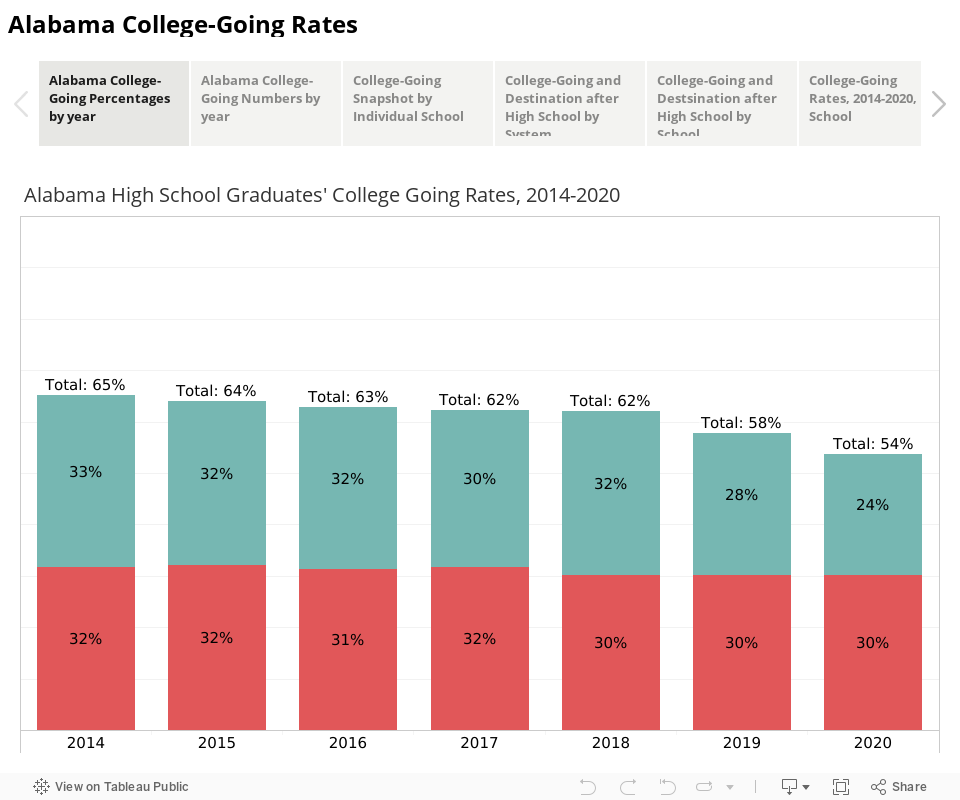
Alabama’s College-Going Rate Down Again for Class of 2020
The college-going rate for Alabama public high school graduates declined substantially in 2020, reaching a seven-year low, more than 10% below the rate in 2014. A drop was expected considering the Covid-19 pandemic’s disruption to normal operations.
According to new data from the Alabama Commission on Higher Education (ACHE), only 54% of the Class of 2020 entered higher education in the 2020-2021 school year. That compares to 65% in 2014. The data is drawn from the National Student Clearinghouse and tracks college enrollment both in-state and out of state, at two-year and four-year public and private colleges and universities.
Since 2014, Alabama’s high school graduation rate has climbed rapidly. That’s led to a larger pool of graduates but also a growing share of individuals earning a high school diploma but not continuing on to college. In 2020, 23,369 out of the 50,514 high school graduates, or 46%, were not found to be enrolled in higher education the year following graduation.
Enrollment at four-year colleges and universities held up surprisingly well in 2020: 15,183 Class of 2020 graduates, or 30%, enrolled at a four-year school. That was despite the online classes and pandemic-related restrictions. That was down slightly in numeric terms, 193 students down from the 2019 total. It was down only slightly in percentage terms because the number of high school graduates was down as well.
The real drop came in the Alabama Community College System (ACCS). Only 24% of Alabama’s 2020 high school graduates, or 11,858 students, enrolled at a two-year college. In the recent past, 30% of graduates enrolled at community colleges. In 2018, a highwater mark, over 16,000 new high school graduates enrolled in community college after graduating high school.
The enrollment declines at the community college level have been taking place across the country. It may stem from the fact that a greater share of community college students are from economically disadvantaged households, and in 2020, the climate of economic uncertainty likely kept some from committing to embark on a college education.
Community colleges had already been experiencing lower enrollment numbers in the year preceding the pandemic but for the opposite reason: When the job market is strong, as it was in 2019, more graduates go straight into the workforce. When unemployment is high, enrollment tends to rise at community colleges, but that didn’t happen in 2020. This fall, community college enrollments hint at some recovery. Preliminary fall enrollment for 2021 points to some recovery at community colleges in Alabama, with total enrollment up 5.6% compared to 2020. But that’s still down 7.8% compared to 2019.
ACCS officials said that because high school students didn’t finish the 2020 school year physically present at school, two-year colleges missed a traditional window for recruiting students. Applications for federal financial aid (FAFSA) were down significantly, as well. With students away from school, k-12 counselors and community college representatives were unable to make a final push for completion. The resources the FAFSA process unlocks often are a deciding factor for students as to whether they can afford to attend.
As schools return to more normal operations, it is hoped that a yearlong push for FAFSA completion and a return to traditional models of student engagement and recruitment will increase college enrollment. ACCS is also partnering with the American Institutes for Research (AIR), the Alabama State Department of Education, Alabama Possible, and ACHE on an experiment testing whether text messages can help students enroll and succeed in college. The grant-funded project aims to keep high school seniors from dropping through the cracks in the summer between high school graduation and the fall semester of that year. Participating students will receive text messages reminding them to complete specific tasks related to college admission and course registration. The data will be analyzed to measure the impact of participation.
Importance for Attainment
The post-graduation trajectory of the state’s high school graduates is important. Alabama has set a goal of improving its level of educational attainment. Producing college and career-ready graduates and propelling them into advanced technical training or toward college degrees is a key priority. The labor market is increasingly demanding higher levels of training and education. Higher levels of educational attainment are associated with higher incomes, lower unemployment, better health, and longer life.
Alabama’s high school graduation rate was 90.6% in 2020, down slightly from the record 92% in 2019. ACHE followed 50,410 high school graduates and found:
27,041, 54%, enrolled in higher education
15,183, 30%, enrolled in four-year colleges
11,858, 24%, enrolled in two-year colleges
23,369, 46%, were not found to have enrolled
90% of enrollees went to a college in Alabama
91% of enrollees went to a public college
College-Going Patterns
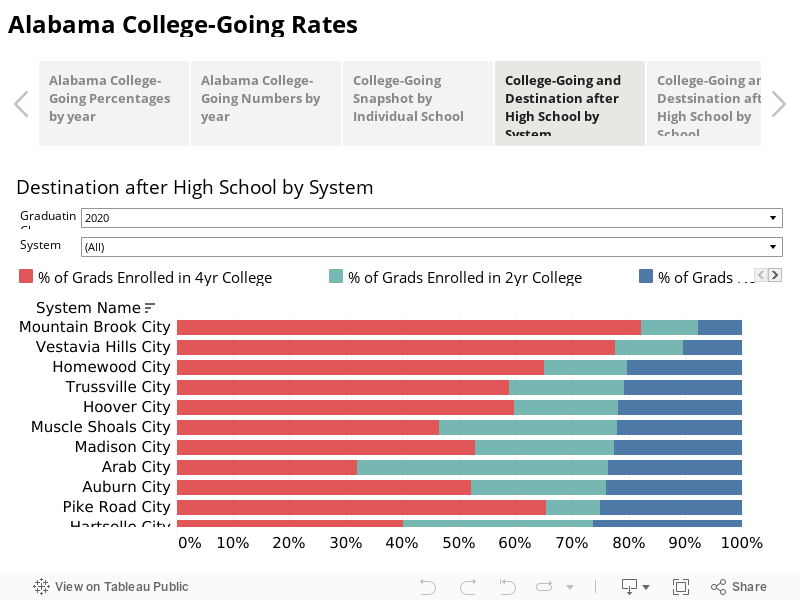
Magnet schools and suburban school systems send higher percentages of students to four-year colleges.
Birmingham’s magnet high school, Ramsay, ranked No. 1 in the state with 93% of its graduates going to college in 2020, most to a four-year university. Three Montgomery County magnet high schools ranked in the top 10 for college-going. Suburban high schools like Mountain Brook, Vestavia-Hills, Hewitt-Trussville, Homewood, and Hoover also rank in the top 10.
Some rural and non-metro counties and systems achieve high college-going rates based on high enrollment in the local community college.
Muscle Shoals and Arab ranked in the top 20 for college-going due to the strength of their community college enrollments.
Rural counties isolated from population centers and urban high schools in high poverty neighborhoods tend to have the lowest college-going rates.
Outliers
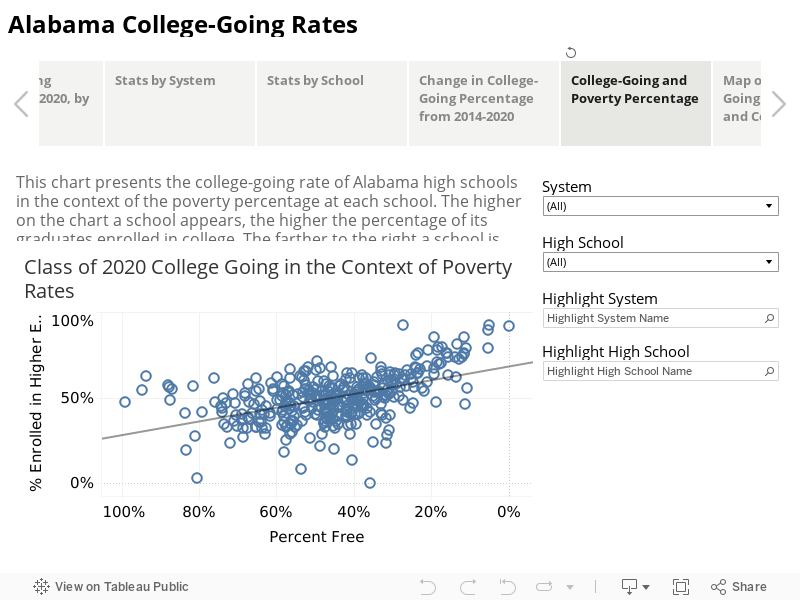
While generalizations about performance can be made, some schools are outliers. The chart below compares Alabama high schools’ college-going rate (the vertical axis) with the student body’s poverty rate (the horizontal axis). The higher a school is on the chart, the higher the percentage of students who leave high school and enter college—the farther to the right on the chart, the lower the level of poverty. The slanted line in the middle is the average of the values, which forms a line of prediction. In general, the college-going rate rises as the student body poverty rate gets lower.
However, some schools outperform the level at which they would be predicted to perform based on the economic status of students. In 2020, examples included high schools like Amelia L Johnson High School in Marengo County (94% qualifying for free lunch; 63% of graduates entering higher education), Pickens County High (76% free and 61% in higher education), and Sweetwater High, also in Marengo County, (50% free and 72% entering higher education).
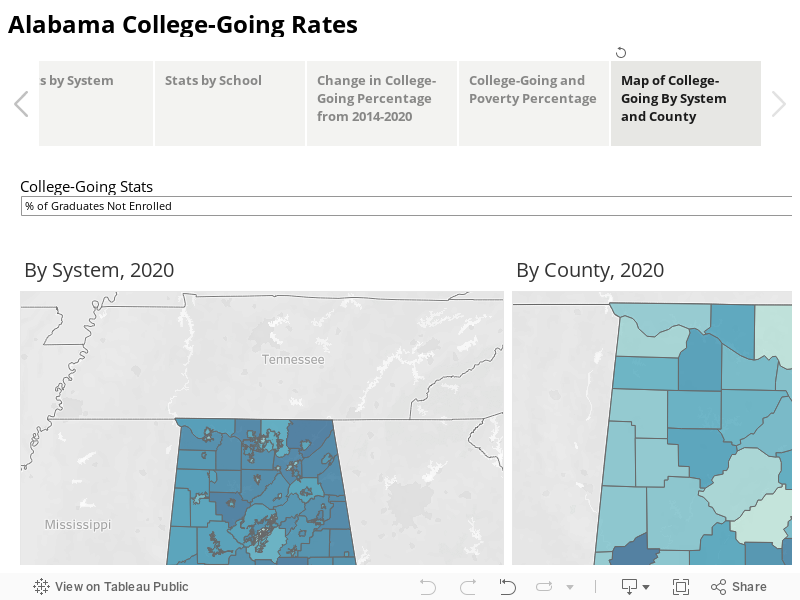
The tabs above the chart allow navigation to a variety of measures of college-going and educational attainment at the school, the system, the county, and the state level. The statistics are presented in graphics, tables, and maps.
Due to Covid, Fewer High School Grads Rate as College and Career Ready
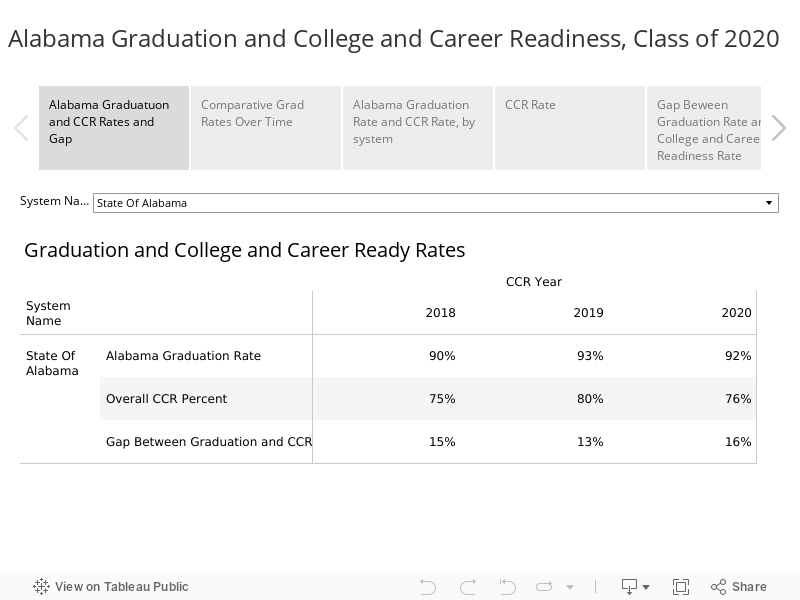
Despite the pandemic, Alabama public schools maintained a high on-time graduation rate in 2020. However, the number and percentage of students meeting the state’s definition of college and career-ready fell by 4 percentage points, likely held back by missed opportunities due to the closure of schools in March 2020.
Because of the challenges posed by the pandemic, state policy allowed seniors to graduate as long as they were in good standing at the end of the third nine weeks of the 2020 school year (local systems made the final decision over who qualified for graduation). For this cohort of seniors, students who were 9th graders in 2017, 92% received a diploma in 2020.
However, when it came to college and career readiness measures, some of those seniors were unable to complete the requirements, as the final months of the 2020 school year were conducted online. Of that same cohort, 76% met the definition of college and career-ready established by the Alabama State Board of Education.
Other data suggest that fewer of those 2020 graduates enrolled in higher education after graduation. The Alabama Commission on Higher Education has reported a 10% decline in the number of Alabama high school graduates enrolling in higher education in the fall of 2020 compared to the previous year, with community college enrollment most affected. The enrollment decline had more to do with the unprecedented circumstances of the pandemic than the decline in the college and career readiness rate (CCR rate).
Still, the CCR rate and the decline in higher education enrollment should be noted as the state seeks to make up for lost time and opportunity in the aftermath of the pandemic. Alabama’s 2020 high school graduation rate will likely be among the nation’s highest again. In 2019, Alabama’s reported federal graduation rate, 91.7%, was the highest in the nation. It was the culmination of a steep rise — Alabama’s graduation rate was 72% in 2011. Historically, the state’s graduation rate has been in the lower tier of states.
Despite the meteoric rise in the graduation rate, the CCR rate and other measures indicate that Alabama schools still have work to do when it comes to turning out prepared graduates. The State Department of Education has called on public schools and systems to close the gap between the graduation rate and the CCR rate. Ideally, every student should graduate ready to succeed in college or in advanced training that leads to higher-paying jobs. The CCR rate can also indicate the range of education and training opportunities available to students at a school or in a system and in normal conditions, serves as a gauge of the effectiveness of the educational program offered.
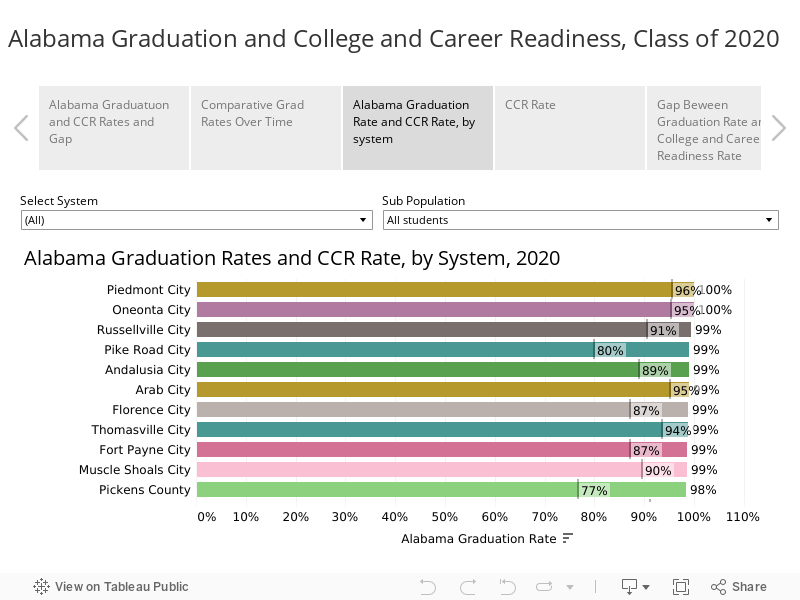
Gaps between school systems
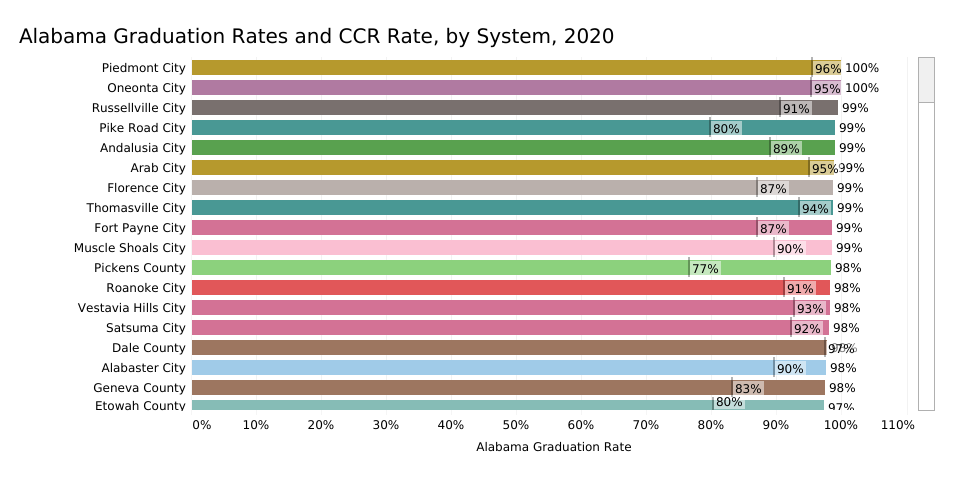
When looking at local school systems, wide gaps remain even in the graduation rate. While 100% of students graduated from Piedmont and Oneota City Schools in 2020, only 69% of Bessemer seniors graduated on time.
The gaps are wide in college and career readiness as well. In 2020, 97% of Dale County seniors were rated as college or career ready, compared to only 25% of Bessemer seniors.
Gaps between student subgroups
Alabama’s graduation rate gap between the races and socio-economic groups has also narrowed at the state level. But when it comes to college and career readiness, gaps between the races and between socio-economic groups persist. For example, 84% of white seniors are rated college and career ready, while only 64% of Black seniors earn the distinction.
Does the CCR rate really matter?
To be counted as college and career ready, an Alabama high school student must meet at least one of six different indicators. In an official sense, a student’s status as college and career-ready doesn’t matter. It is not required for graduation. Neither colleges nor employers look for the rating on an individual’s resume.
On the other hand, some of the indicators have real-world implications for individuals. They can help an individual get into college, secure college credit, or successfully apply for a job. The chart below shows the percentage of seniors earning the college and career readiness distinction through each of the established measures. A detailed description of each of the measures follows the chart.
The changes in the percentage of students earning college and career readiness in each of the categories reflect changes in emphasis, investment, and effort. The changes can also reflect strategic choices by students or schools to pursue the easiest path for meeting college and career readiness requirements.
Below are the indicators of college and career readiness as established by the State Board of Education.
1. Score at or above the benchmark on one section of the ACT, the college-readiness test
In recent years, about 50% of students benchmarked on the ACT in at least one subject, most commonly English. According to ACT, a student who scores at or above the benchmark in a subject has a 50% chance of making a B in a college course in that same subject.
For the Class of 2020, only 46% of students made at least one benchmark score. With the coming of the pandemic, ACT had to cancel several test dates, which may have prevented some students from retaking the test and reaching the benchmark score. In light of that, many colleges and universities waived the ACT requirement for admission.
Still, the ACT results might also indicate that the disruption left some seniors less prepared for college.
2. Score Workforce Ready on the ACT WorkKeys test
In addition to its academically oriented college-readiness test, ACT offers WorkKeys, a standardized test that measures practical skills in math, language, and comprehension, skills as they might be applied in the workplace.
In 2019, 61% of seniors scored Silver or above on the WorkKeys, an indicator that they had the practical skills needed to function in most workplaces.
For the class of 2020, only 45% of seniors earned scored Silver or above. One potential reason for the drop is that schools are no longer required to give WorkKeys to every senior. Many systems, particularly those with an orientation toward college preparation, let students who scored college-ready on the ACT skip the WorkKeys test.
Also, for the Class of 2020, the WorkKeys was given in the Fall of 2019 as usual. But normally, spring re-tests offer opportunities for students to improve their scores. These re-tests were canceled in 2020 due to the pandemic.
For some, that lack of opportunity to better their WorkKeys scores has implications. Employers in some regions of the state, particularly West Alabama, have come to value the WorkKeys results as a meaningful credential. But there is a remedy. For those graduates who want the credential, Alabama’s two-year colleges offer preparation and WorkKeys testing.
3. Score 3 or above on an Advanced Placement (AP) or International Baccalaureate (IB) end-of-course test
AP and IB are college-level courses offered in high schools led by a trained teacher, following a nationally standard curriculum. Scoring 3 or above (out of 5) on an end-of-course test can earn a student college credit in the corresponding college course. IB exams were canceled in 2020 because of the pandemic. However, AP tests proceeded in an online format. Impressively, the percentage of seniors earning AP credit (11%) was only down 1 percentage point from the previous year.
4. Earn an industry-recognized credential through a Career Technical Education course
In 2020, 35% of seniors graduated having earned at least one industry-recognized credential. Considering that many of the credential certification tests don’t take place until the end of the year, it is impressive that the percentage of seniors earning a credential was only down two percentage points, from 37% in 2019.
Overall, the number of credentials earned in 2020 was down significantly compared to 2019 (final tallies are still being compiled). However, seniors appeared to have already earned credentials in prior years or earlier in the school year. The change to online instruction after March of 2020 disrupted the normal process of awarding credentials and closed some avenues for earning them. However, schools were encouraged to make a special effort to help seniors complete their industry-recognized credentials, an effort that appears to have been largely successful.
5. Earn college credit through dual enrollment
This is the one area that actually saw an increase, with 15% of graduating seniors earning college credit through dual enrollment in 2020 compared to 14% the year prior.
Dual enrollment, having high school students take classes for credit through universities or community colleges, has been gradually increasing in participation. Apparently, the courses were able to continue and be completed virtually.
6. Successfully enlist in the military
In 2020, 2% of graduating seniors enlisted in the military, a percentage that has been consistent for several years.
One notes trends in looking across the years at the variety of methods for achieving college and career readiness. The percentage of students CCR Ready on the ACT has been relatively flat. The percentage CCR Ready through WorkKeys has grown as schools and students have become more familiar with the test, though it fell back in 2020 thanks to changes in policy and disruptions. An increasing number and percentage of students have demonstrated college and career readiness through success in AP courses, dual enrollment, and in particular, participation in career technical education.
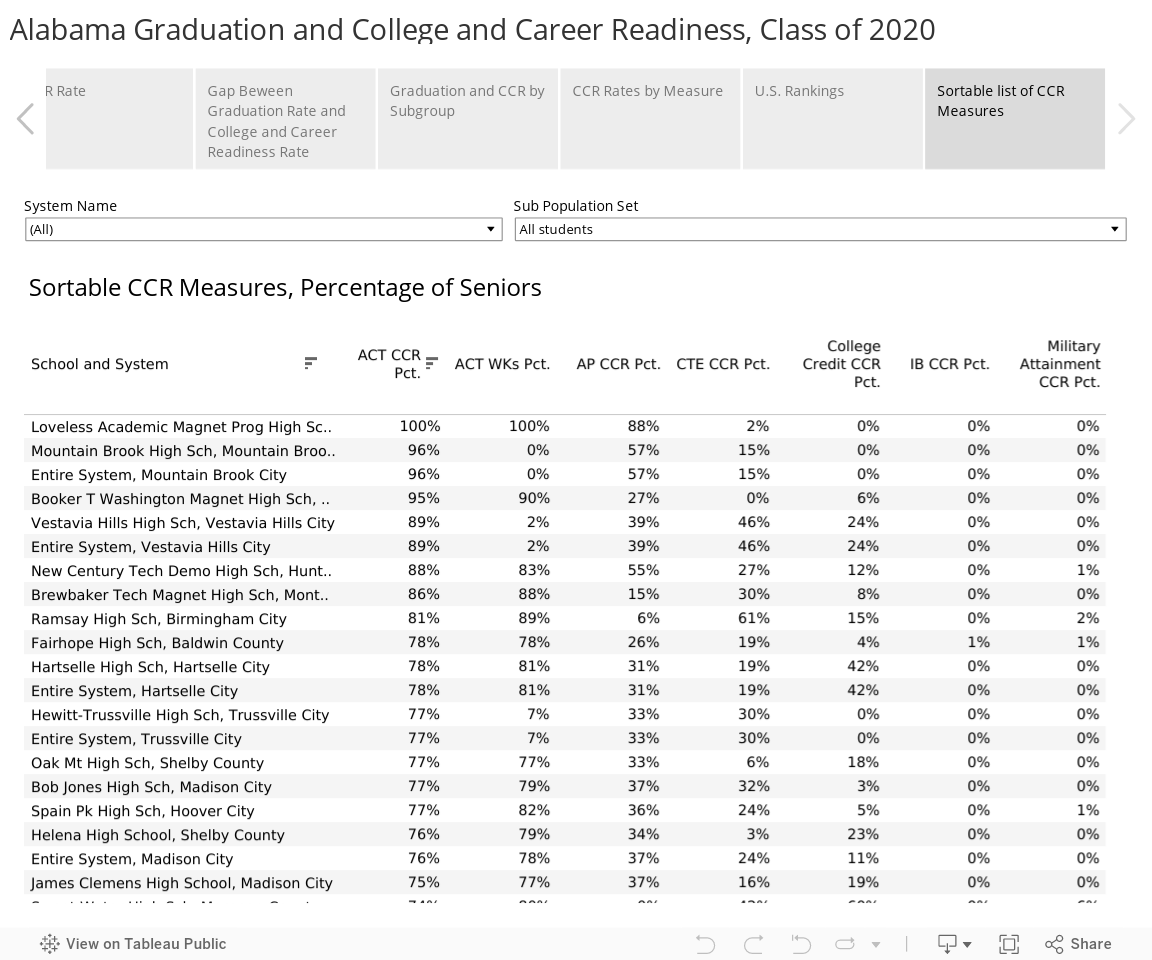
Different approaches to achieving college and career readiness
While a statewide analysis of college and career readiness measures provides some insight, a closer examination of local system results reveals that there is a tremendous variety in how different school systems approach college and career readiness for their students. For example, magnet schools and affluent suburban systems record high percentages of students earning benchmark scores on the ACT or AP. Systems with a close relationship with a local community college might offer more dual enrollment opportunities. At the same time, schools with strong career technical education programs might produce more college and career-ready students through that route.
Conclusion
The Covid-19 pandemic presented unprecedented challenges for schools and students. Schools and students posted relatively minor and understandable declines on major performance measures like the high school graduation rate and the college and career ready rate.
However, at a time when the state has set lofty goals for raising the educational attainment level of the workforce, both the pandemic and underlying trends point to needed areas of focus.
Alabama’s high school graduation rate is high. Still, students need to graduate better prepared with meaningful credentials and solid evidence that they are ready for education and training beyond high school. In 2020, 24% of high school seniors failed to demonstrate college and career readiness, even by the relatively generous standards established by the Alabama State Board of Education.
Among Alabama high school graduates, an increasing number are not seeking higher education. Some of that may stem from a robust job market that is drawing graduates straight into the workforce. Some of the most recent drop is pandemic related. However, for individuals’ long-term prosperity and for the state’s economic future, our workforce needs increasing levels of education and training. There needs to be continued attention to building solid bridges between high school and the next level of opportunity. There is also an opportunity to reach out to recent graduates, particularly 2020 graduates affected by the pandemic, to make sure they have access to advanced education and training.
Deaths Exceed Births but Surge in Domestic Migration Powers Alabama Population Growth
Recent data from the U.S. Census Bureau indicate a growing number of people moving to Alabama prior to the Covid pandemic, which helped offset population loss due to a rising death rate and declining birth rate. The estimated number of net new domestic migrants was 13,115 in 2020, the largest inflow of the decade.
That estimate data, released earlier this month, is generated annually by the Bureau. Those estimates use the 2010 Census count as a base and attempt to capture population change by tracking births, deaths, and migration. The actual census count, conducted in 2020, showed even stronger growth than the estimates have indicated.
By April 1, 2020, Alabama’s statewide population had climbed above 5 million, according to the official 2020 Census enumeration. That total, 5,024,279, exceeds by more than 100,000 the Census Bureau’s estimate of Alabama’s population for July 1, 2020. Going forward, estimates will be re-calibrated using the Census count as a basis. On the basis of the count, Alabama kept all seven U.S. House Districts. According to the official Census count, Alabama added 244,543 residents since 2010.
According to the counts, Alabama’s population grew by 5% from 2010 to 2020. The Carolinas, Tennessee, and Georgia grew at about twice that rate, but Alabama grew faster than Mississippi, which lost population, and Louisiana and Arkansas, both of which grew at a rate of 3%. Florida’s population grew by 15%, adding a staggering 2.7 million new residents.
Components of Change
Though Census population estimates were off compared to the actual 2020 count, the estimates and components that drive the estimates provide insight into the drivers of population change in Alabama throughout this past decade. The newest estimates, released earlier this month, and the estimates from prior years present some patterns:
Over the course of the decade, Alabama birth rates fell, and death rates climbed as the population aged.
International migration provided growth in the early part of the decade.
As international immigration faltered in the final years of the decade, domestic migration to Alabama surged.
Aging and Fertility
The most fundamental elements of population change are births and deaths. Census estimates are based on the number of birth and death certificates issued, with some short-term projection built-in since there is a two-year lag in getting the actual county-level data..
According to Census estimates, over the course of the decade, Alabama and the U.S. saw a decline in the number and rate of births and a rise in the number and rate of deaths. For the first time in 2020, the Census Bureau estimated that more people died in Alabama than were born.
If the estimates accurately captured the trend, deaths will likely exceed births in Alabama again in 2021. The math that drives these numbers has to do with the size of generations and the size of families. Members of the Baby Boom Generation, the extra-large cohort born between 1945 and 1965, have entered years of increased mortality, causing a rise in the death rate. Meanwhile, younger generations, with fewer members, have had children later in life and are having fewer children. In addition, the Covid-19 pandemic led to increased mortality, between March and July 1, 2020. The Census Bureau made a national-level adjustment for increased mortality from Covid-19 between March and July of 2020. That will factor into population change this year as well.
But the effects of these changes in fertility and mortality play out unevenly across the U.S. and across Alabama counties. Places that have attracted younger residents have a lower median age and a higher share of births. Places that are losing population tend to retain a higher share of older individuals and consequently see higher death rates. Birth rates are highest in the counties with urban centers, or universities, or cities’ suburbs. Death rates are highest in rural communities where the population is older. The social, ethnic, and racial composition of a community affects birth rates as well. Hispanic and Black families tend to have more children.
The visualization above allows you to explore how the differences play out in different states. The visualization below allows you to explore those differences among Alabama counties.
For example, Blount County has a pattern that reflects the state as a whole. However, using the selector on the right, toggle to Madison or Shelby County, and observe a different pattern: The number of deaths is still rising, but so is the number of births as young families move in, producing a positive rate of natural increase. Conecuh County, by contrast, shows a steep fall in births and a rise in deaths, producing a population decline through natural factors.
Migration
Beyond births and deaths, population change is driven by who is moving in and who is moving out, measures of migration. The Census Bureau develops estimates of movement within the United States (domestic migration) and between the U.S. and other counties (International migration). Over the past decade, general regional migration patterns emerged: Southern and Western states have gained through domestic migration. Northeastern states and California have gained through international migration. Rural counties in the interior South, Rust Belt, and the Plains States have seen moderate growth or some population decline. In the end, all states except Mississippi, Illinois, and West Virginia added population between 2010 and 2020, with gains concentrated in the cities and metropolitan, suburban counties, and retirement and recreational destinations.
According to the estimates, Alabama experienced two different periods of migration since 2010. In the first part of the decade, rising international in-migration offset weak growth and even population loss through domestic migration. Over a span of years, Alabama had more residents moving away than arriving from other states. But late in the decade, those factors flipped: a surge in domestic in-migration replaced faltering international immigration as the driver of population change.
Time will tell whether that surge in domestic migration will resume or even accelerate after the Covid pandemic. Early indications suggest it might. Unemployment in Alabama is down close to pre-pandemic levels, historic lows that should attract movers. There are indications that movements already underway are continuing and even accelerating. The Wall Street Journal analyzed data from permanent change of address forms filed with the U.S. Post Office. The results suggest that during the pandemic, there has been a movement out of dense urban areas in the Northeast towards the South and toward smaller metros and suburbs. The pandemic has accelerated retirements and migration to retirement destinations, adding fuel to the strong growth in Alabama’s Baldwin County, for instance.
As has been the case throughout the decade, estimates indicate that most of the growth in Alabama is occurring in a handful of counties, led by Baldwin and Madison, home to Huntsville. A second tier of growth magnets consists of Lee County, home of Auburn University; Shelby County, south of Birmingham; Limestone County, adjacent to Huntsville; and Tuscaloosa, home to the University of Alabama.
In the estimates for 2020, more counties in Huntsville’s orbit, including Colbert and Lauderdale in the Shoals and Morgan, are showing population gains. Meanwhile, in Southeast Alabama, counties around Dothan, including Houston and Coffee, appear to be picking up residents, as well.
Jefferson, Montgomery, and Mobile counties all lost population in 2020, according to the estimates. All three counties have been net exporters of domestic migrants throughout the decade but have made up for the loss through natural increase and the arrival of residents from other countries. However, with the clampdown on immigration during the Trump years, made even more acute by the pandemic, all three counties saw sharper losses. That was particularly true in Jefferson, which had a rising number of deaths, a lower number of births, a depressed level of international immigration, and a higher net loss through domestic migration. Jefferson was estimated to have 3,197 fewer people living in the county in July 2020 than in July 2019, the biggest numeric loss among Alabama counties.
Dallas County continued to lose population with an estimated 1,084 fewer residents in 2020. According to the estimates, Dallas County had a population of 36,098 in 2020, a cumulative loss of 7,715 people since 2010. Dallas experienced the second-fastest rate of decline since 2010, 17.6%, among Alabama counties. Only Perry County, at 17.9%, had a greater rate loss. Perry’s population, estimated at 8,698 in 2020, is second lowest in Alabama, outranking only Greene County’s 7,990.
Prior to the pandemic, with unemployment at a historic low, Alabama was on the verge of a labor force shortage. Perhaps in response, the state appears to have begun drawing increased numbers of new residents. For Alabama to reach its economic potential, the state will need to continue to draw migrants. The existing population is aging, with the Baby Boom generation headed for retirement.
Drawing more workers into the state may help Alabama meet the goal established for the state workforce system: add 500,000 highly-skilled workers to its workforce by 2025. But reaching that goal will also require bringing more Alabamians back into the workforce, increasing labor force participation by increasing access to training and education.