Since 1994, the Alabama Kids Count Data Book has documented and tracked the health, education, safety, and economic security of children at the state and county levels.
For the 30th edition, VOICES also interviewed the directors of Alabama’s child-serving agencies and included excerpts.
The Data Book serves as both a benchmark and roadmap for how children are faring and is used to raise visibility of children’s issues, identify areas of need, set priorities in child well-being and inform decision-making at the state and local levels.
Below are some of the findings from this year’s data:
– Children of color and children in poverty are shown to have much poorer outcomes and much poorer achievements in education.
– Child population continues to decrease. Over the last year, the number of children grew in only 20 of 67 counties.
– Children in Alabama are becoming increasingly more diverse ethnically and racially. While white and Black child populations are declining, since 2000, Hispanic children grew approximately 276%. The Asian/Pacific Islander population grew by 120%.
– The infant mortality rate has slightly decreased from 8.1 to 7.6 per 1,000 live births from 2011-2021. In real numbers, that means that 443 babies did not live to their 1st birthday in 2021. Maternity care is critical. 34.3% of Alabama counties are defined as maternity care deserts. More than 28% of Alabama women had no birthing hospital within 30 minutes, which is more than double the U.S. rate.
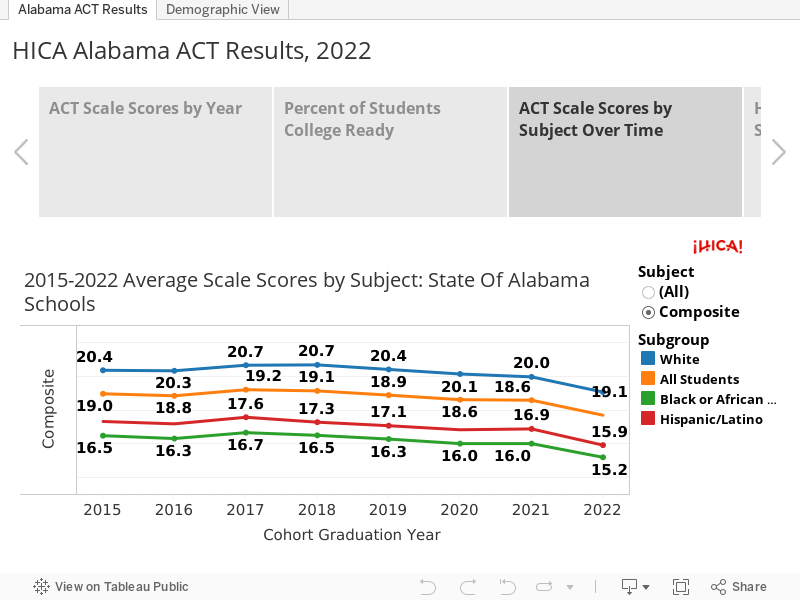
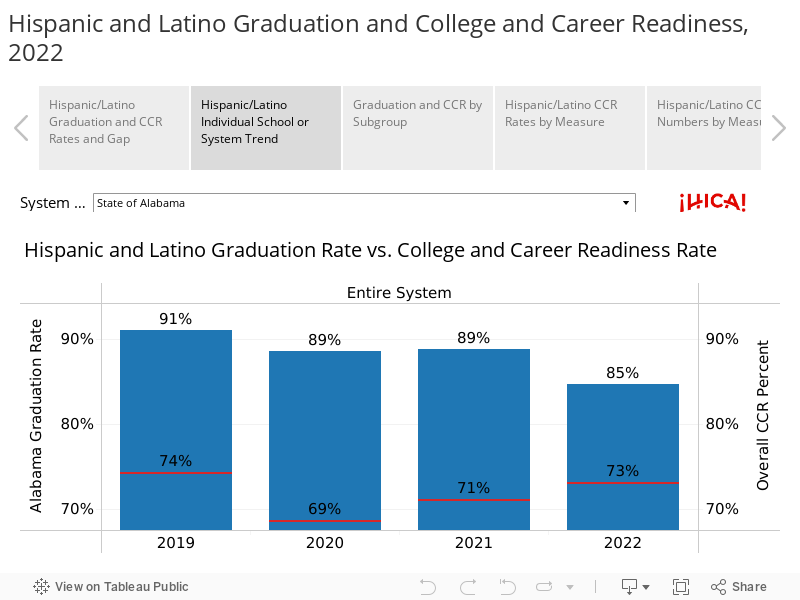
– In 2022, the percentage of Alabama high school students meeting college and career ready requirements was 79.1% from 76.5% in 2021.
– 2023 Work-based learning programs (Dual Enrollment and Career Training Programs) are estimated to have had an economic impact of $420,209,126.
– From 2015-2023 there has been a 16.9% increase in the number of children entering foster care services. Parental drug use is the leading reason for children entering foster care, making up 44%, followed by neglect at 22%.
– 10.4% of children in the state are living in extreme poverty. Black and Hispanic populations are disproportionately affected (38.3% and 36.7% respectively), while white children make up 13.5% of children in extreme poverty.
See how children in all 67 counties of our state are faring in education, health, economic security, and more. VOICES believers that every child in Alabama should have access and opportunity to thrive and become all they can be, and hopes that by utilizing this book’s insights, we can identify the challenges, set priorities, track our progress, and achieve real outcomes for children and families.
Want to see this data at the national level? Visit the national KIDS COUNT Data Center to access hundreds of indicators, download data and create reports and graphics!
Huntsville and Baldwin Continue Population Gains, Birmingham Remains in Top 50 of U.S. Metros
The Huntsville area and Baldwin County continue to add more new residents, while growth in Shelby County and St. Clair County helped the Birmingham Metro Area return to positive growth after two years of population loss. That’s according to new estimates of population change in U.S. counties and metro areas published by the U.S. Census Bureau. The new estimates identify population totals and components of population change as of July 1, 2023.
In addition to the growth in Shelby and St. Clair, Birmingham’s metro population got a boost from an accounting change. In the 2022 estimates, the Birmingham-Hoover MSA ranked No. 50 in population among metropolitan areas and seemed destined to fall out of the top 50 metro areas.
However, in 2023, Walker County was re-added to the Birmingham metro, which boosted the Birmingham MSA population by almost 65,000 and allowed it to climb to the 47th most populous metropolitan area.
Metro areas are clusters of counties where a significant percentage of the population moves back and forth across county lines for work and commerce. According to the most recent data, about 26% of Walker County’s resident workforce commuted to work in Jefferson County or other counties in the MSA. That’s above the 25% threshold that triggers inclusion in the MSA. Walker was historically part of the MSA.
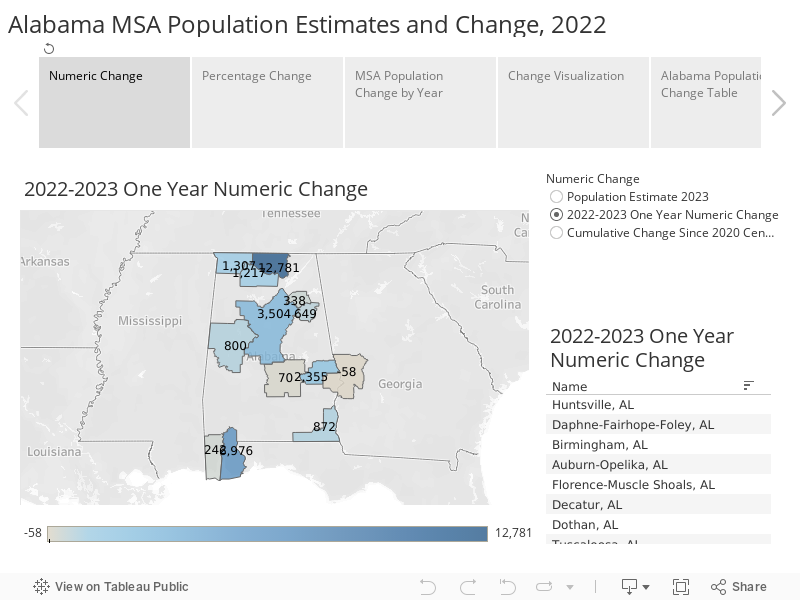
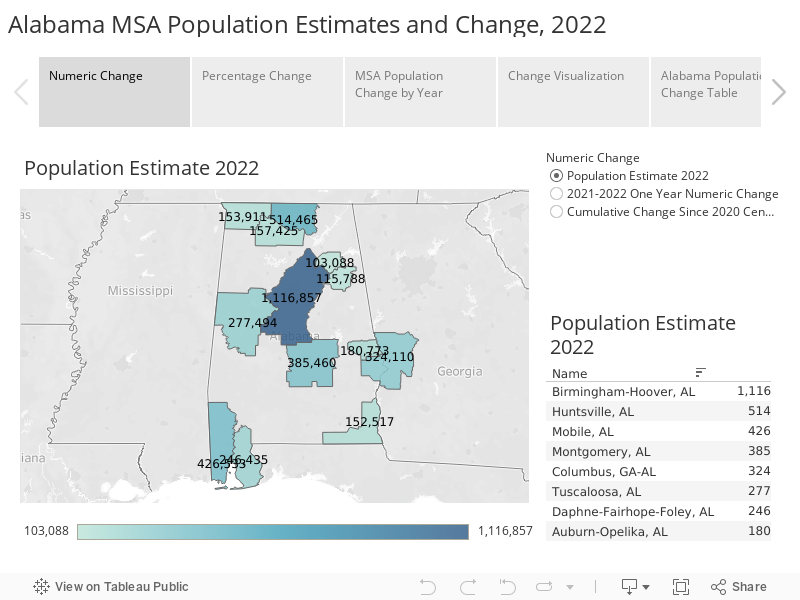
Consisting of 7 counties with a population of 1.2 million, Birmingham is the state’s largest metro area. Huntsville’s MSA, comprised of Limestone and Madison Counties, is second with 527,254.
Trends
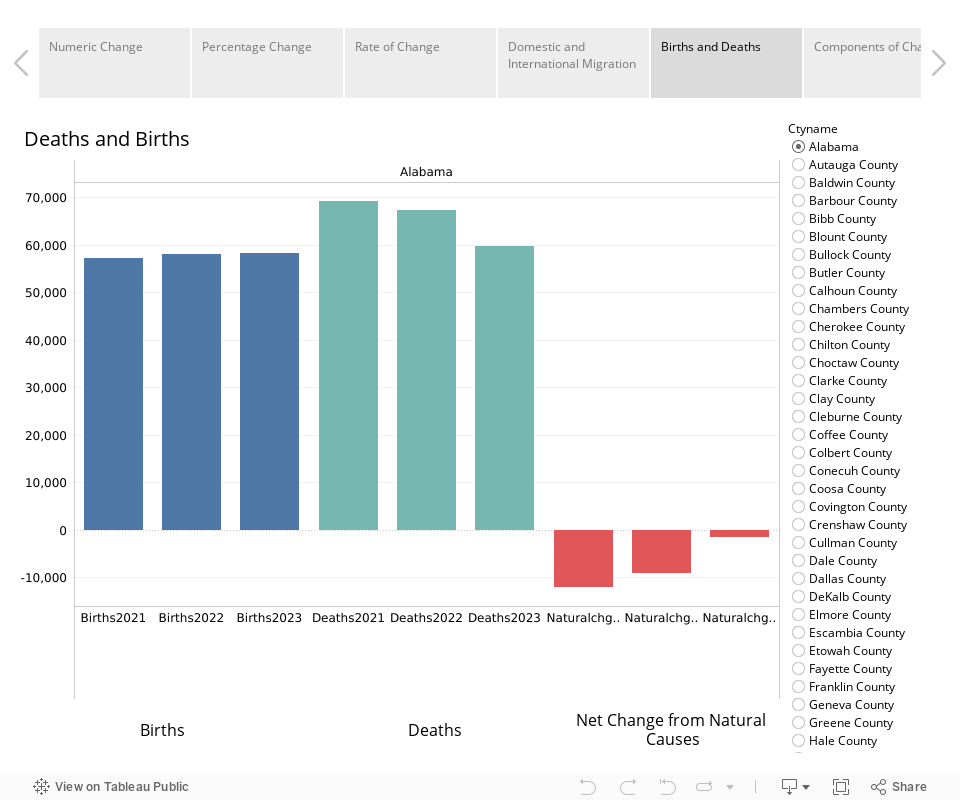
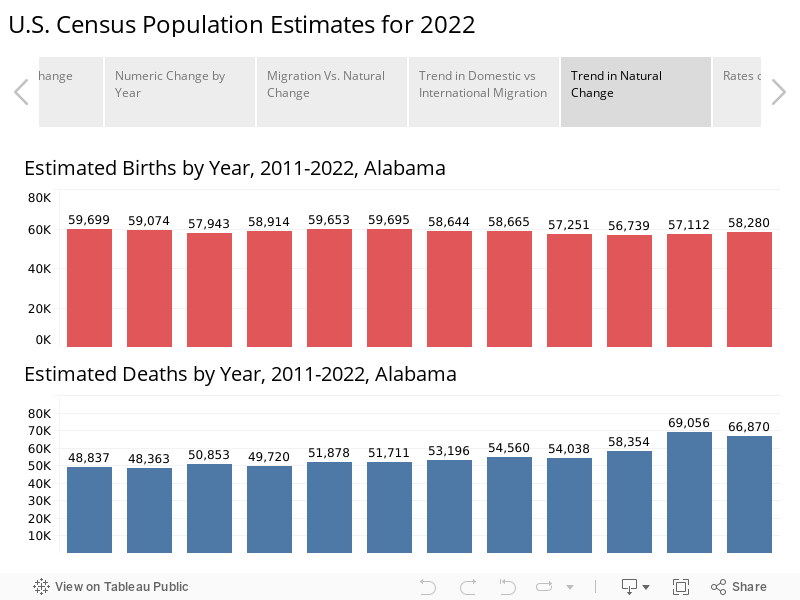
As observed in the PARCA’s analysis of state-level estimates released earlier this year, the decline in deaths related to the Covid-19 pandemic improved baseline conditions for population growth. In the 2021 and 2022 estimates, deaths far outnumbered births. In 2023, the number of deaths in Alabama continued to drop, though, due to an aging population and lower birth rate, deaths still outnumbered births.
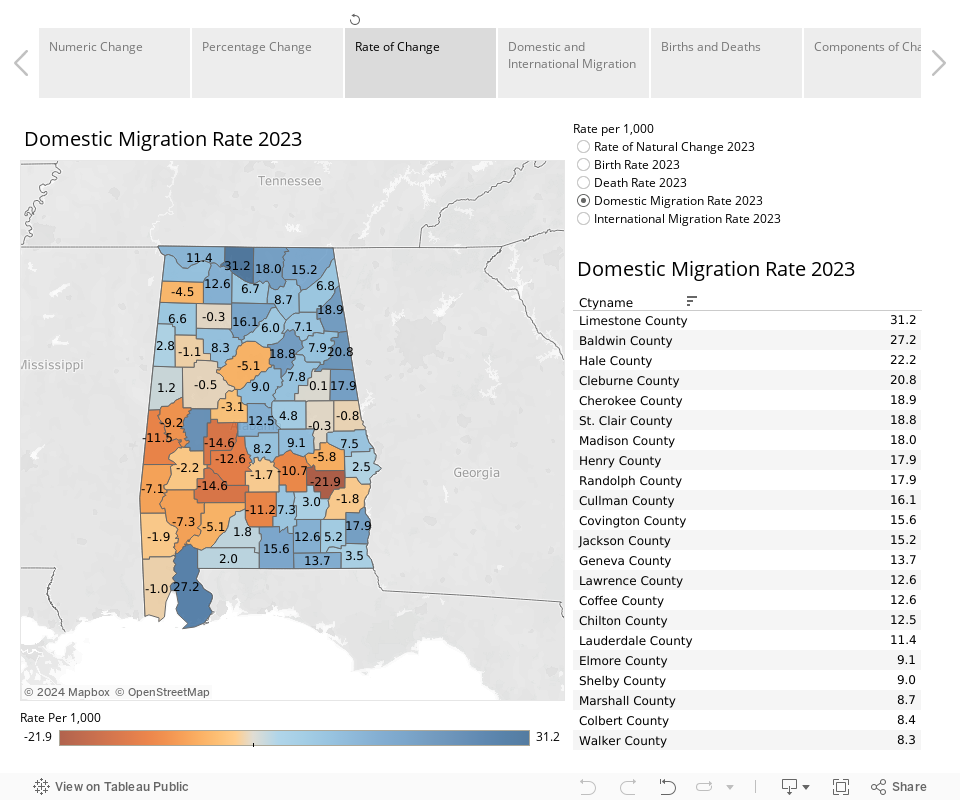
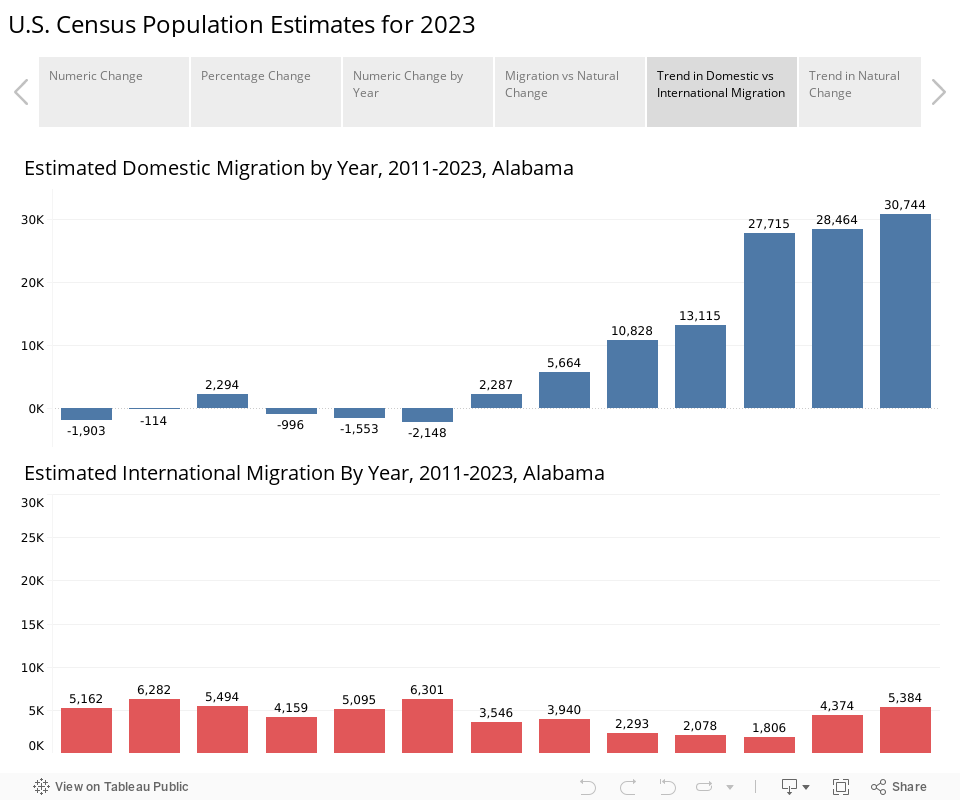
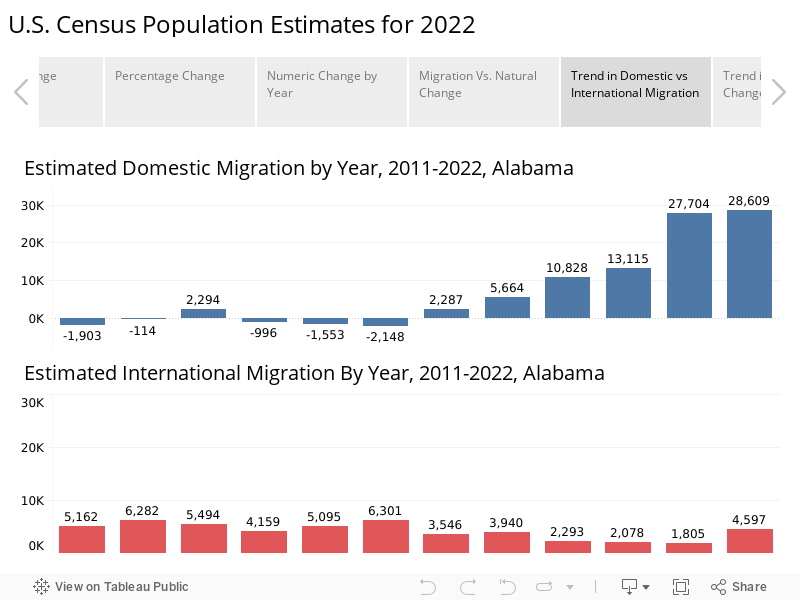
International immigration to Alabama remains low, but domestic immigration continues to accelerate, according to the estimates. Alabama netted 30,744 new residents through domestic in-migration in 2023, building on an upward trend.
Domestic in-migration is powering population growth in hot spots like Madison, Limestone County, and Baldwin, as well as in suburban counties around Birmingham and Montgomery. In the latter cases, the central county is losing population while suburban counties gain. Across Alabama, 38 of the 67 counties are seeing more people moving into the county than moving out.
Calhoun and Etowah counties, home to Anniston and Gadsden, respectively, are showing population growth after years of decline. Mobile County also grew, breaking a streak of decline. In fact, all of the state’s metro areas posted population gains except for the Columbus, GA—Metro Area, which includes Phenix City and Russell County.
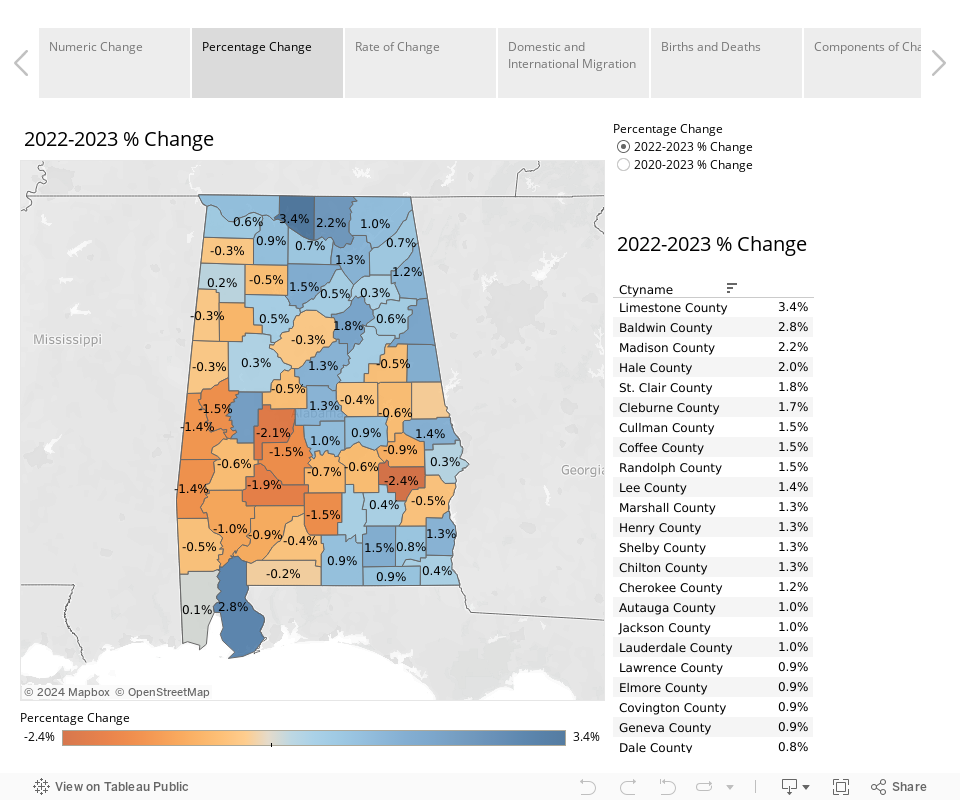
Rural counties, particularly in Alabama’s Black Belt, continued to lose population. The biggest drop in percentage terms was Bullock County, where the population declined by 2.4%, or 246 residents, according to the estimates. Hale County was the exception to the Black Belt trend. Hale added 289 residents, which amounts to a 2% population increase in a year.
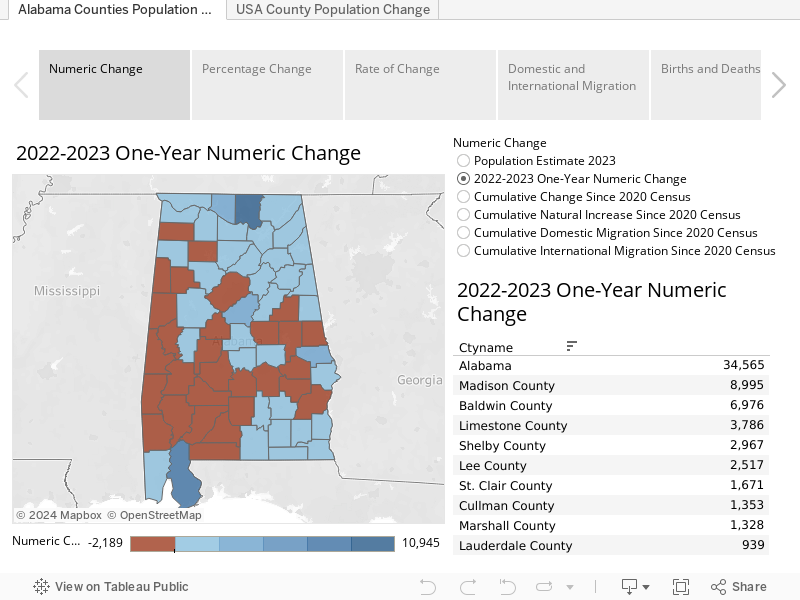
In numeric terms, Jefferson County lost the most people, with a decline of 2,186. That is less of a loss than in 2021 or 2022. Deaths were down, births were up, resulting in a positive natural change of 394. International migration added 818, a slight increase over the year before. However, domestic migration remained a drain, with 3,417 more people moving out of the county than moved in, according to estimates.
Montgomery County also continues to see significant domestic outmigration, but a slight rise in international migration and births and a drop in deaths helped offset the outmigration. Montgomery County’s population has decreased by 1,321. Autauga, Elmore, Chilton, and Lee counties grew.
Mobile County grew with a smaller net decline in domestic migration, a slight increase in international migration, and a return to positive natural change (more births than deaths). According to the estimates, Mobile County posted a net addition of 242 residents.
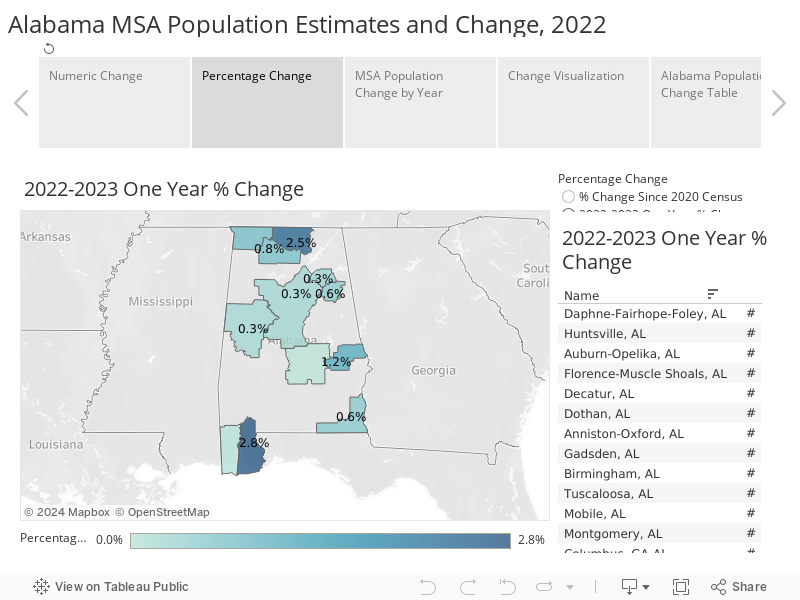
Next-door neighbor Baldwin County added 6,976 people, mostly because of people moving to the coastal county. In percentage terms, the Baldwin County metro area, officially the Daphne-Fairhope-Foley MSA, grew faster than any of the state’s other metro areas.
However, the Huntsville MSA netted the most new residents, with Madison County adding 8,995 and Limestone County adding 3,786. Adjacent North Alabama counties like Lauderdale, Morgan, Marshall, Jackson, Lawrence, and Cullman grew.
The Dothan-area Wiregrass counties also saw population growth, as did counties on the Alabama-Georgia Border like Cleburne, Randolph, and Cherokee.
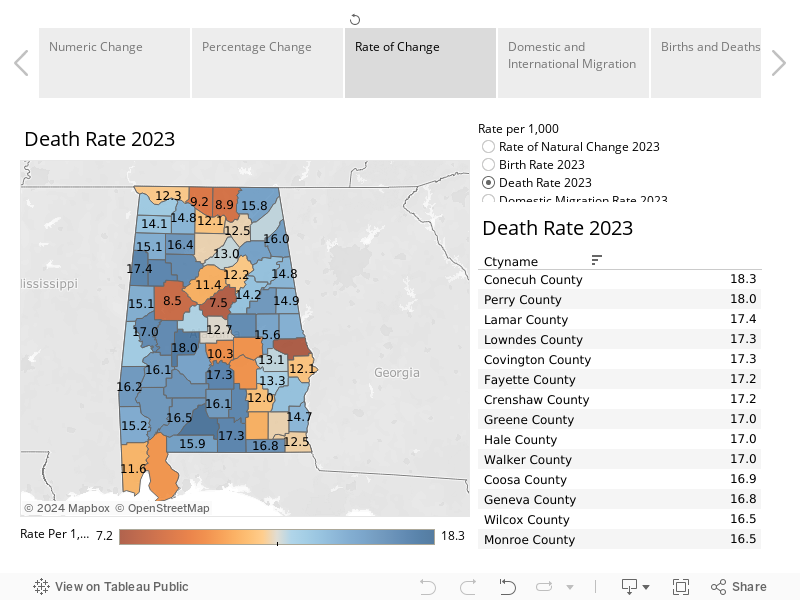
Most counties bordering Mississippi lost population. The median age in rural counties tends to be higher, which correlates with higher death rates.
Those counties also tend to experience more people moving out than moving in.
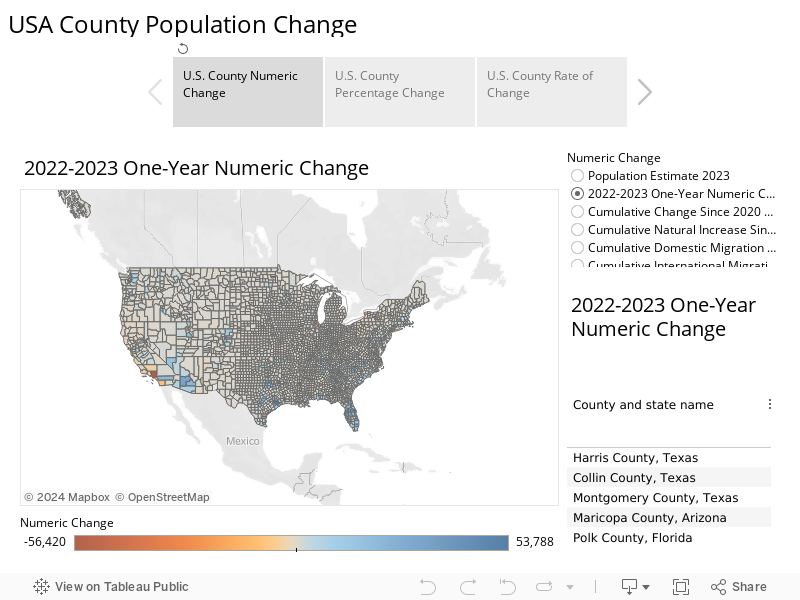
Use the tabs and menus to explore the estimates for counties and metros you are interested in. If you want to see how Alabama compares with the rest of the United States, visualizations of the population estimates and change are available for counties and metros across the country.
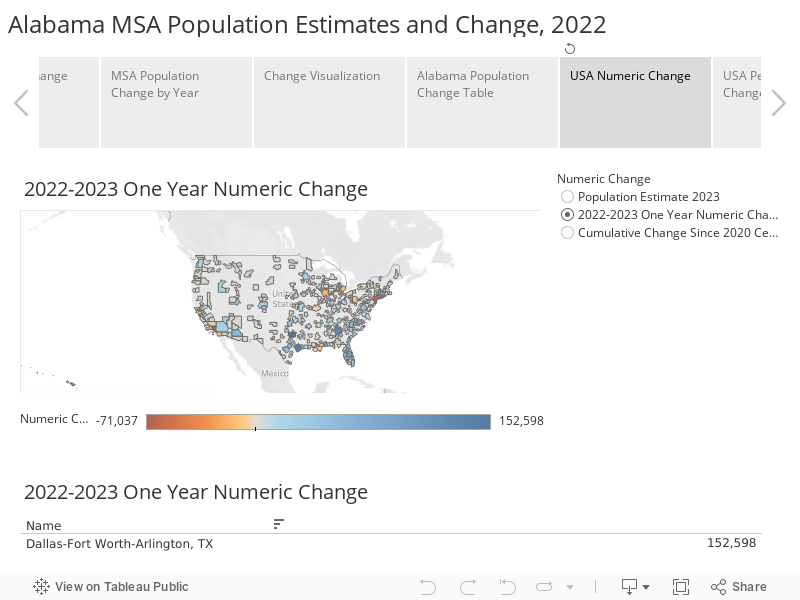
Similar stats are available for metro areas as well. Use the controls to zoom in on areas of interest.
Alabama Public Opinion Survey
PARCA’s most recent public opinion survey finds, once again, aversion to certain taxes, support for public education, and mistrust in state government. At the same time, the survey finds a lack of consensus on how the state should respond to other critical issues.
Among the findings:
Alabamians continue to rank education as the most important state government activity.
Large majorities of Alabamians say the state spends too little on education and healthcare.
Alabamians have an aversion to taxes but say upper-income residents pay too little.
Alabamians are willing to pay more taxes to support education but do not agree on which taxes should be increased.
A plurality (48%) of Alabamians would prefer to educate their children in public schools.
A majority of Alabamians support school choice options.
A large majority believe private schools receiving state funds should meet all standards required of public schools.
PARCA’s annual public opinion survey was conducted between October 24 and December 26, 2023. The mixed-mode sample includes a mix of respondents from a statewide random digit dialed (RDD) sample of cell and landline numbers and an Internet panel provided by Qualtrics. The poll of over 500 Alabama residents was conducted by Dr. Randolph Horn, Samford University, Assistant Vice President for Enrollment Research and Professor of Political Science.
Results of the survey indicate many opportunities for officials to demonstrate responsiveness to public concerns and leadership in crafting public policy solutions.
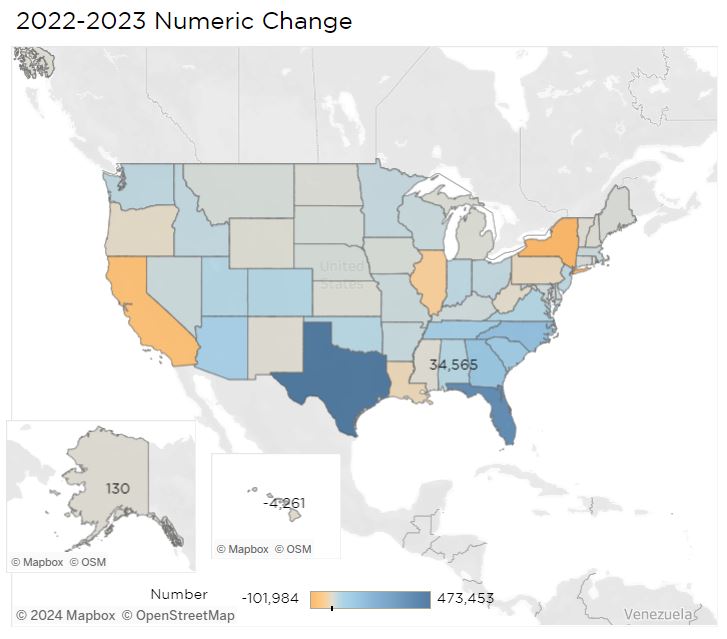
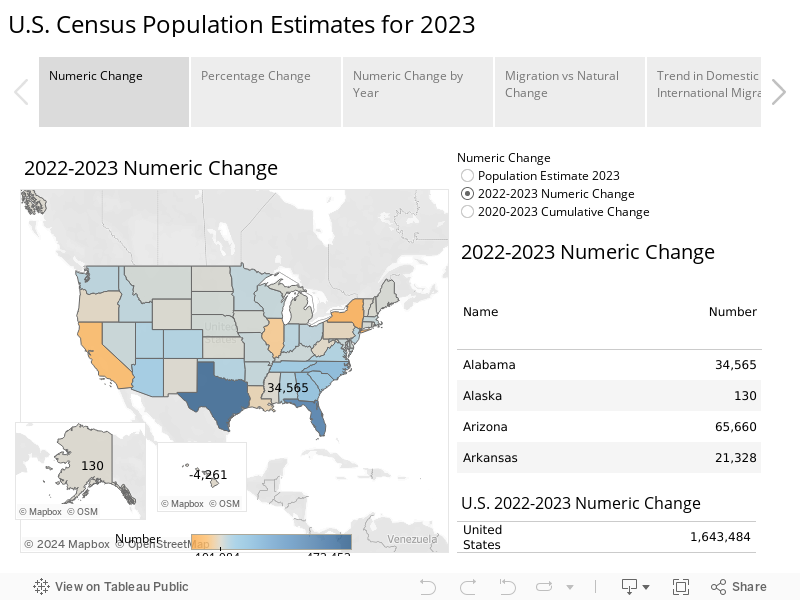
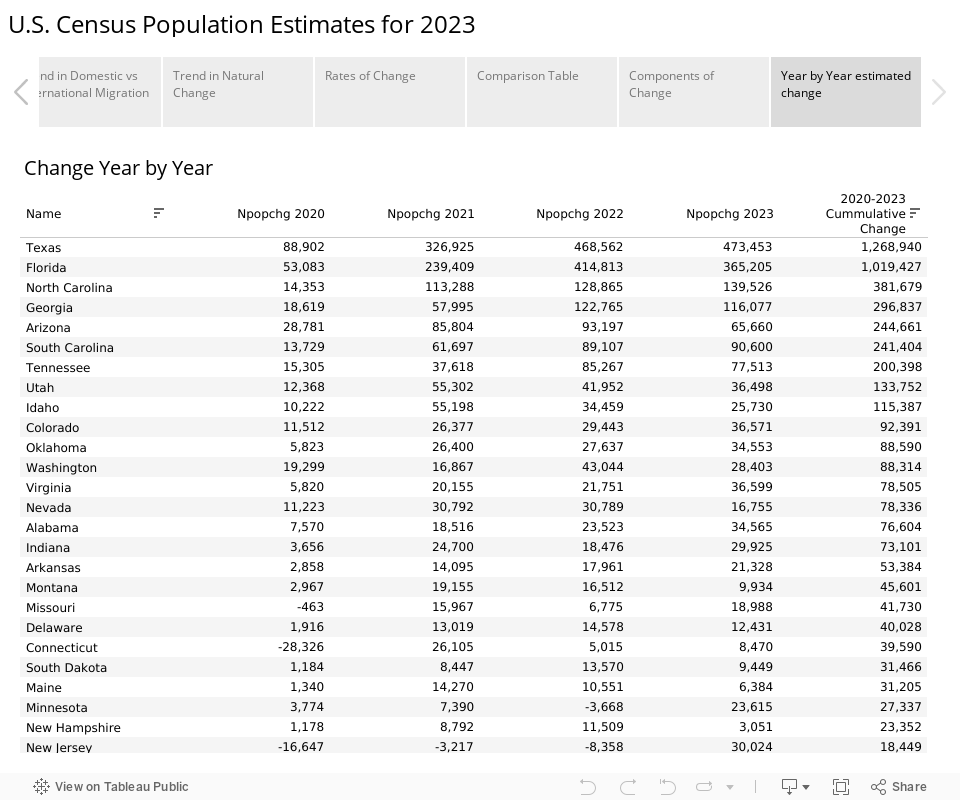
Alabama’s population increased by 34,000 last year to 5.1 million, driven by increased domestic migration and a decreasing number of deaths, according to the latest population estimates published by the U.S. Census Bureau, covering the period between July 1, 2022 and July 1, 2023.
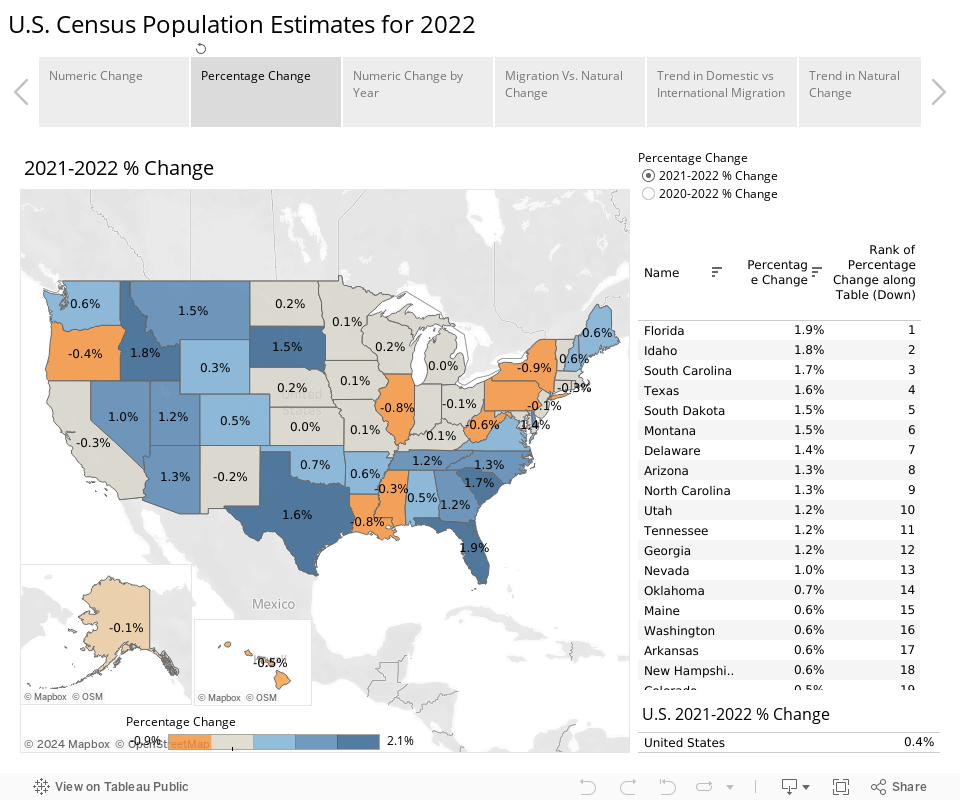
That’s the 15th fastest rate of growth among U.S. states and ranks 11th in terms of the number of people added. Still, Alabama’s growth rate trails other Sunbelt and Mountain West states, including Southeastern neighbors like Florida, Georgia, Tennessee, and South and North Carolina.
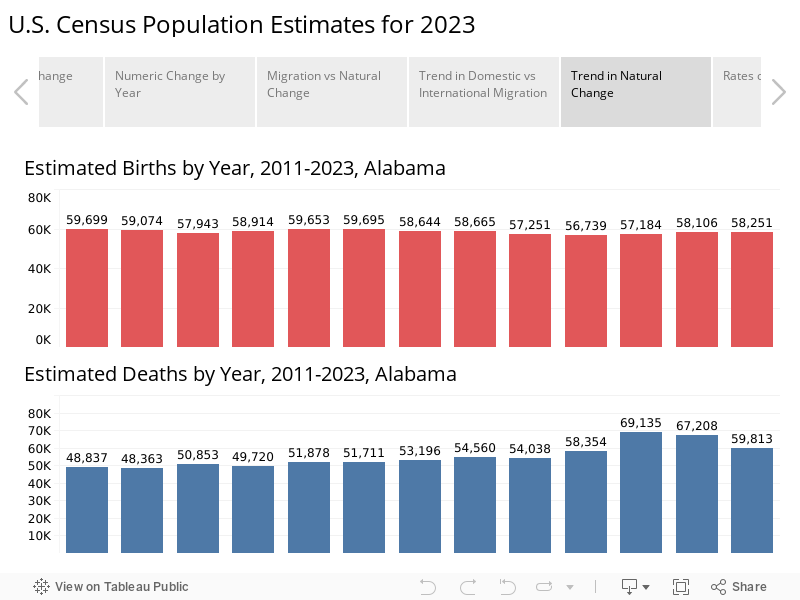
Alabama’s death rate fell from the third-highest in 2021 to the sixth-highest in 2023. Still, more people died in Alabama than were born here, according to the 2023 estimates. But the gap narrowed. Births were up by about 150, and the estimated number of deaths in 2023 was down by almost 10,000 from the 2021 peak of the Covid-19 pandemic.
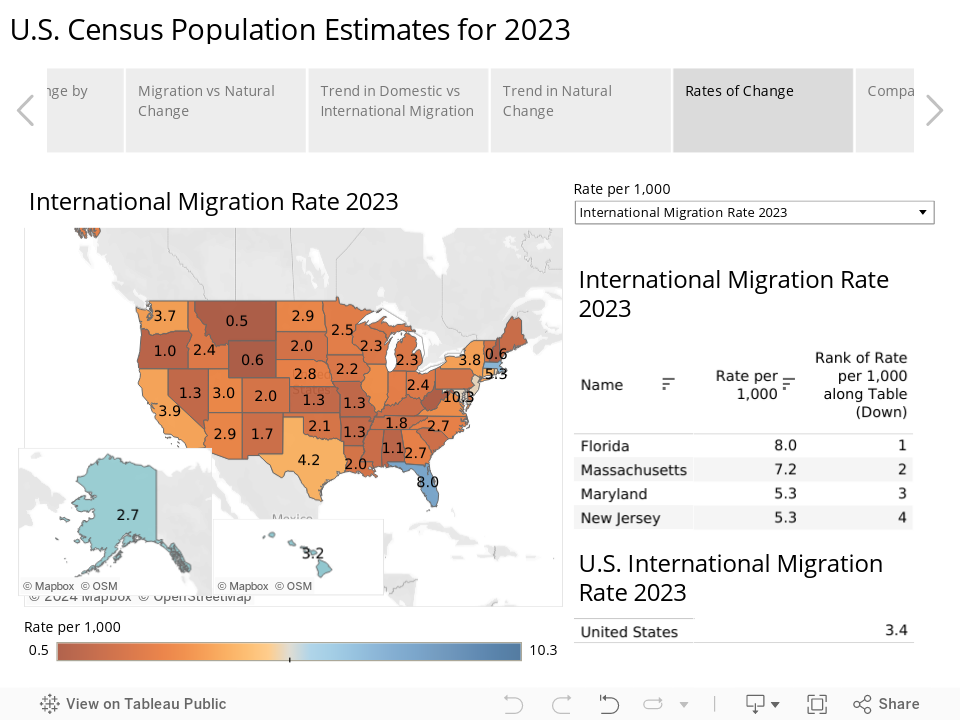
Most of the population change resulted from people moving in from other states. The state received 30,744 domestic migrants, 2,000 more than moved in the year before. International migration into Alabama increased to 5,364 net new arrivals, or about 1,000 more than the year before.
In 2023, Alabama’s rate of domestic immigration was the 10th highest in the U.S. However, Alabama still has one of the lowest rates of international immigration among states, ranking No. 45.
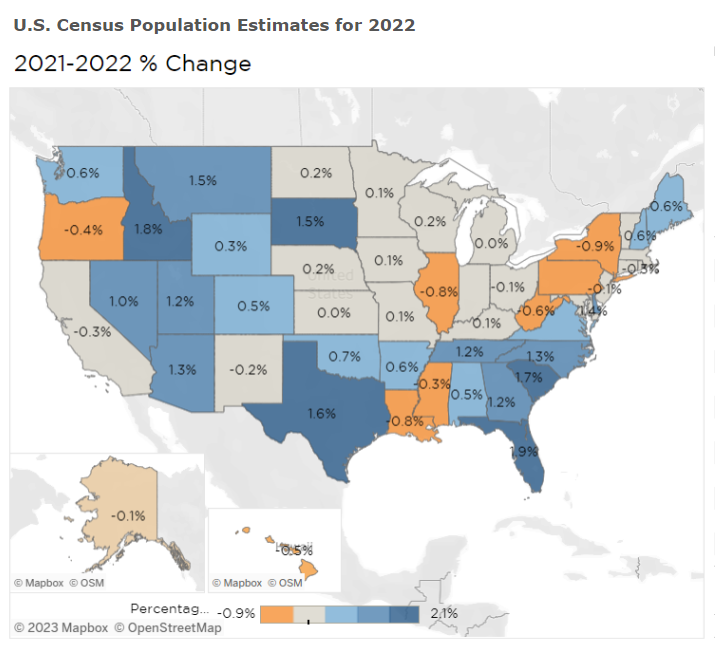
Texas and Florida added the most people. New York, Illinois, and California saw the biggest declines. All the Southeastern states, with the exception of Louisiana and Mississippi, recorded population increases. That pattern has been consistent since 2020.
Census population and change estimates for counties, metro areas, and cities will be released later in the year. Use the tabs and menus in the visualizations to explore the data.
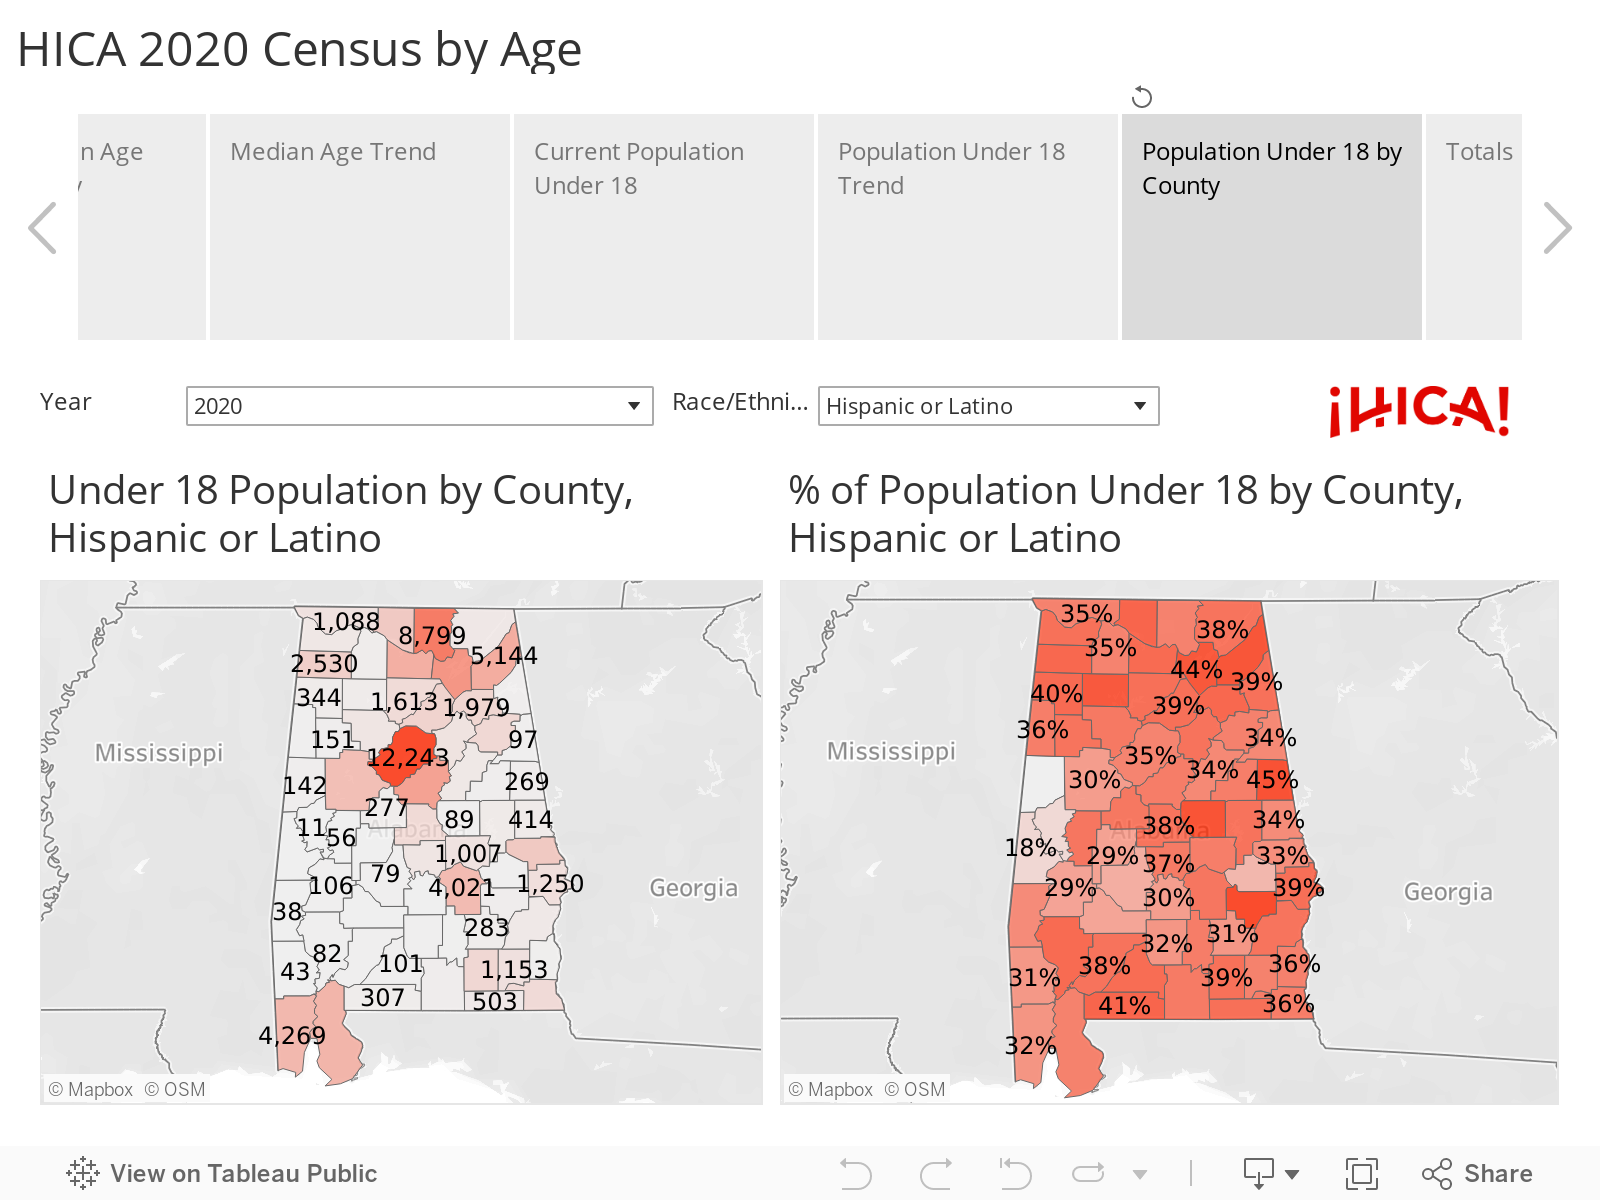
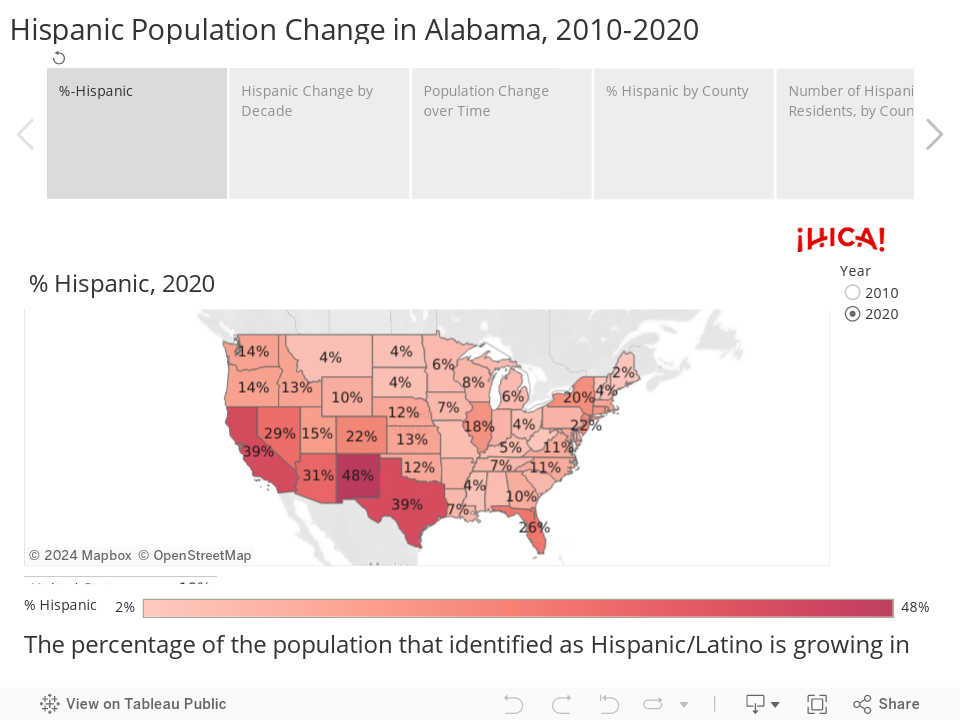
Data Collection for Hispanic and Latino Alabamians with HICA
According to the 2020 Census, Alabama’s Hispanic and Latino community represented just 5% of Alabama’s population, but between 2010 and 2020, the growth in that demographic accounted for 32% of the state’s total population growth. That’s according to a new analysis prepared by PARCA for the Hispanic Interest Coalition of Alabama (HICA).
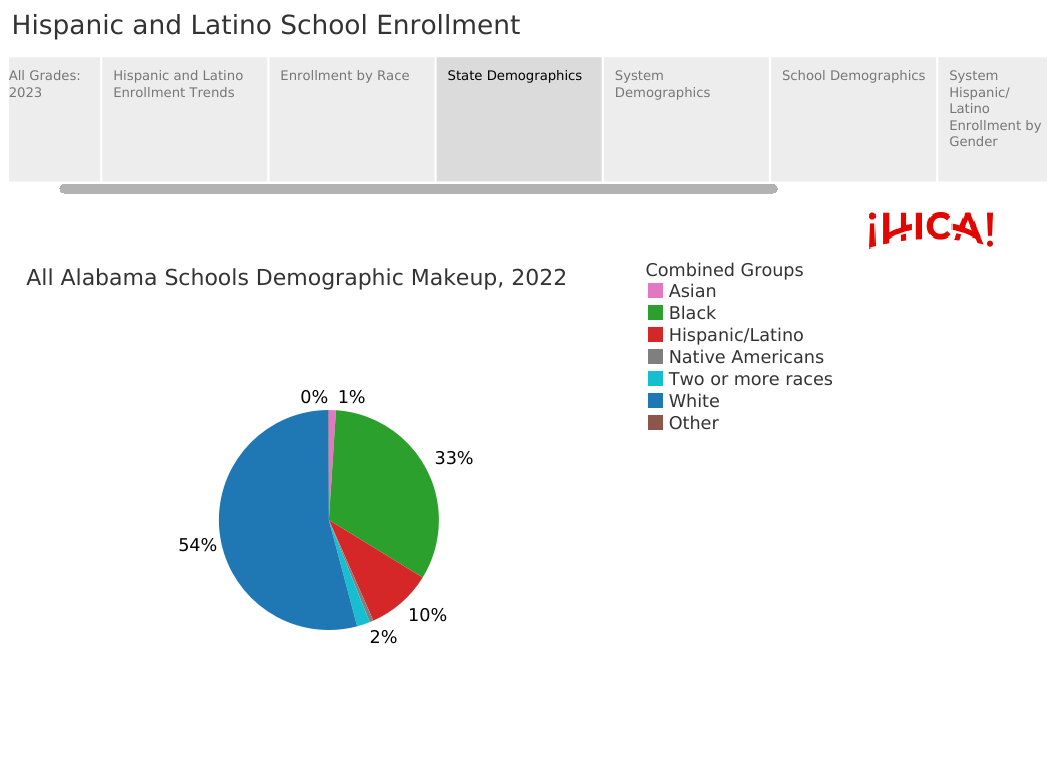
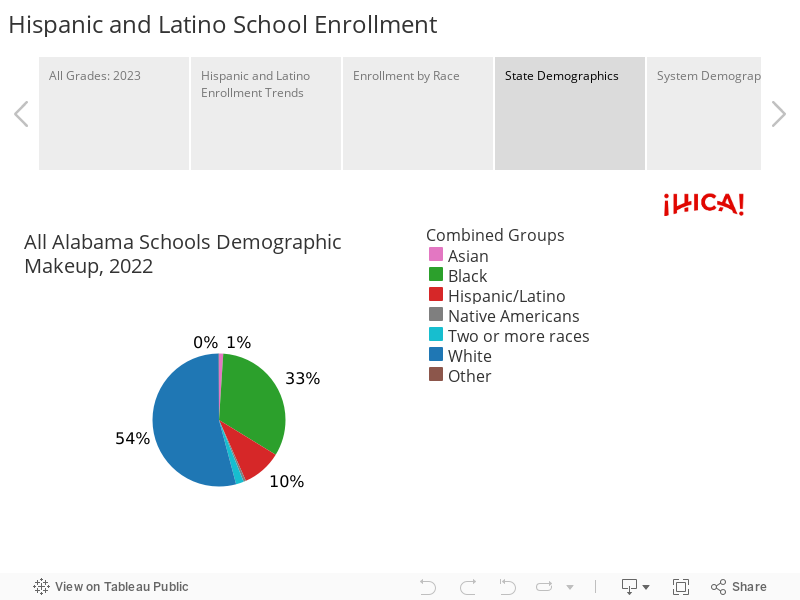
With or without immigration, Alabama’s Hispanic population is poised to become an increasingly important part of the state’s tapestry: 10% of students enrolled in Alabama public schools are of Hispanic descent, as is almost 10% of the population under 25. According to the Census Bureau’s 2021 estimates, 65% of Alabama Hispanics were born in the U.S., an increase from the 50% native-born percentage in 2010.
HICA is a non-profit organization that was founded in 1999 to serve Latino immigrant communities across Alabama. HICA works for Hispanic and Latino families in a myriad of ways: family services, legal advice about citizenship and immigration, financial literacy programs, workforce development, small business lending, civic engagement, and more.
HICA, having long understood the importance of data in advocacy and planning, reached out to PARCA to do a wide-net study on Hispanic and Latino Alabamians. The goal was to generate a collection of data that would inform not just their organization’s strategy but inform policy and encourage further research into ethnicity and outcomes. This data collection includes metrics relating to finances, education, demographics, and more. PARCA used a wide variety of trusted sources with the most relevant authority and recency.
The data tells many interesting stories, not all of which are extenuated in our presentation of it. With the help of HICA, we have outlined what we think are the most relevant and interesting trends. The data is broken into three major categories: Education, Finance, and Population Characteristics.
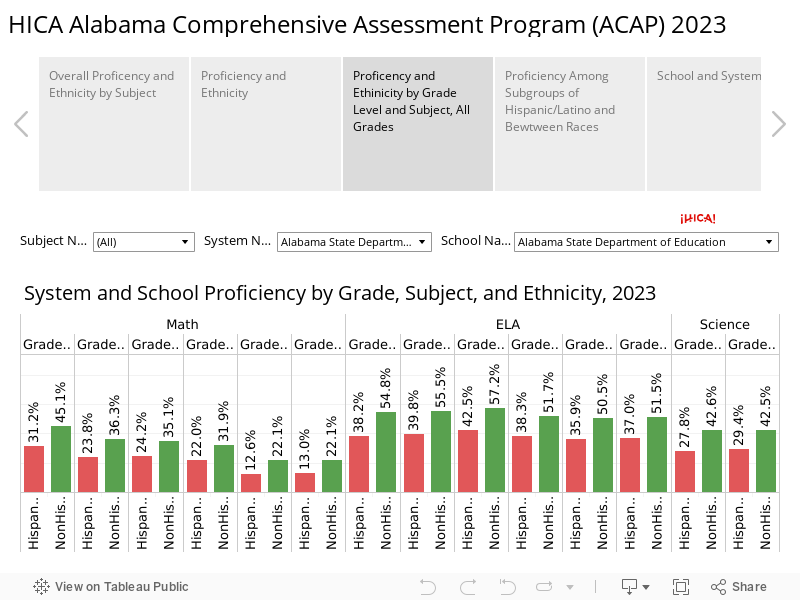
It is critical to understand educational outcomes and their correlation to ethnicity. To understand education and how demographic groups experience and succeed differently, we must look at a variety of ages and lenses. Our data includes four focuses: ACT, Education Attainment, Graduation Rate and Career Readiness, and School Enrollment.
Alabama Comprehensive Assessment Program
Source: Alabama Department of Education
ACT
Source: ACT for years 2015-2022.
Education Attainment
Source: Census Bureau’s 2021 American Community Survey 5-Year Detailed Tables.
Graduation Rate and Career Readiness
Source: Alabama Department of Education.
School Enrollment
Source: Alabama Department of Education
Finance
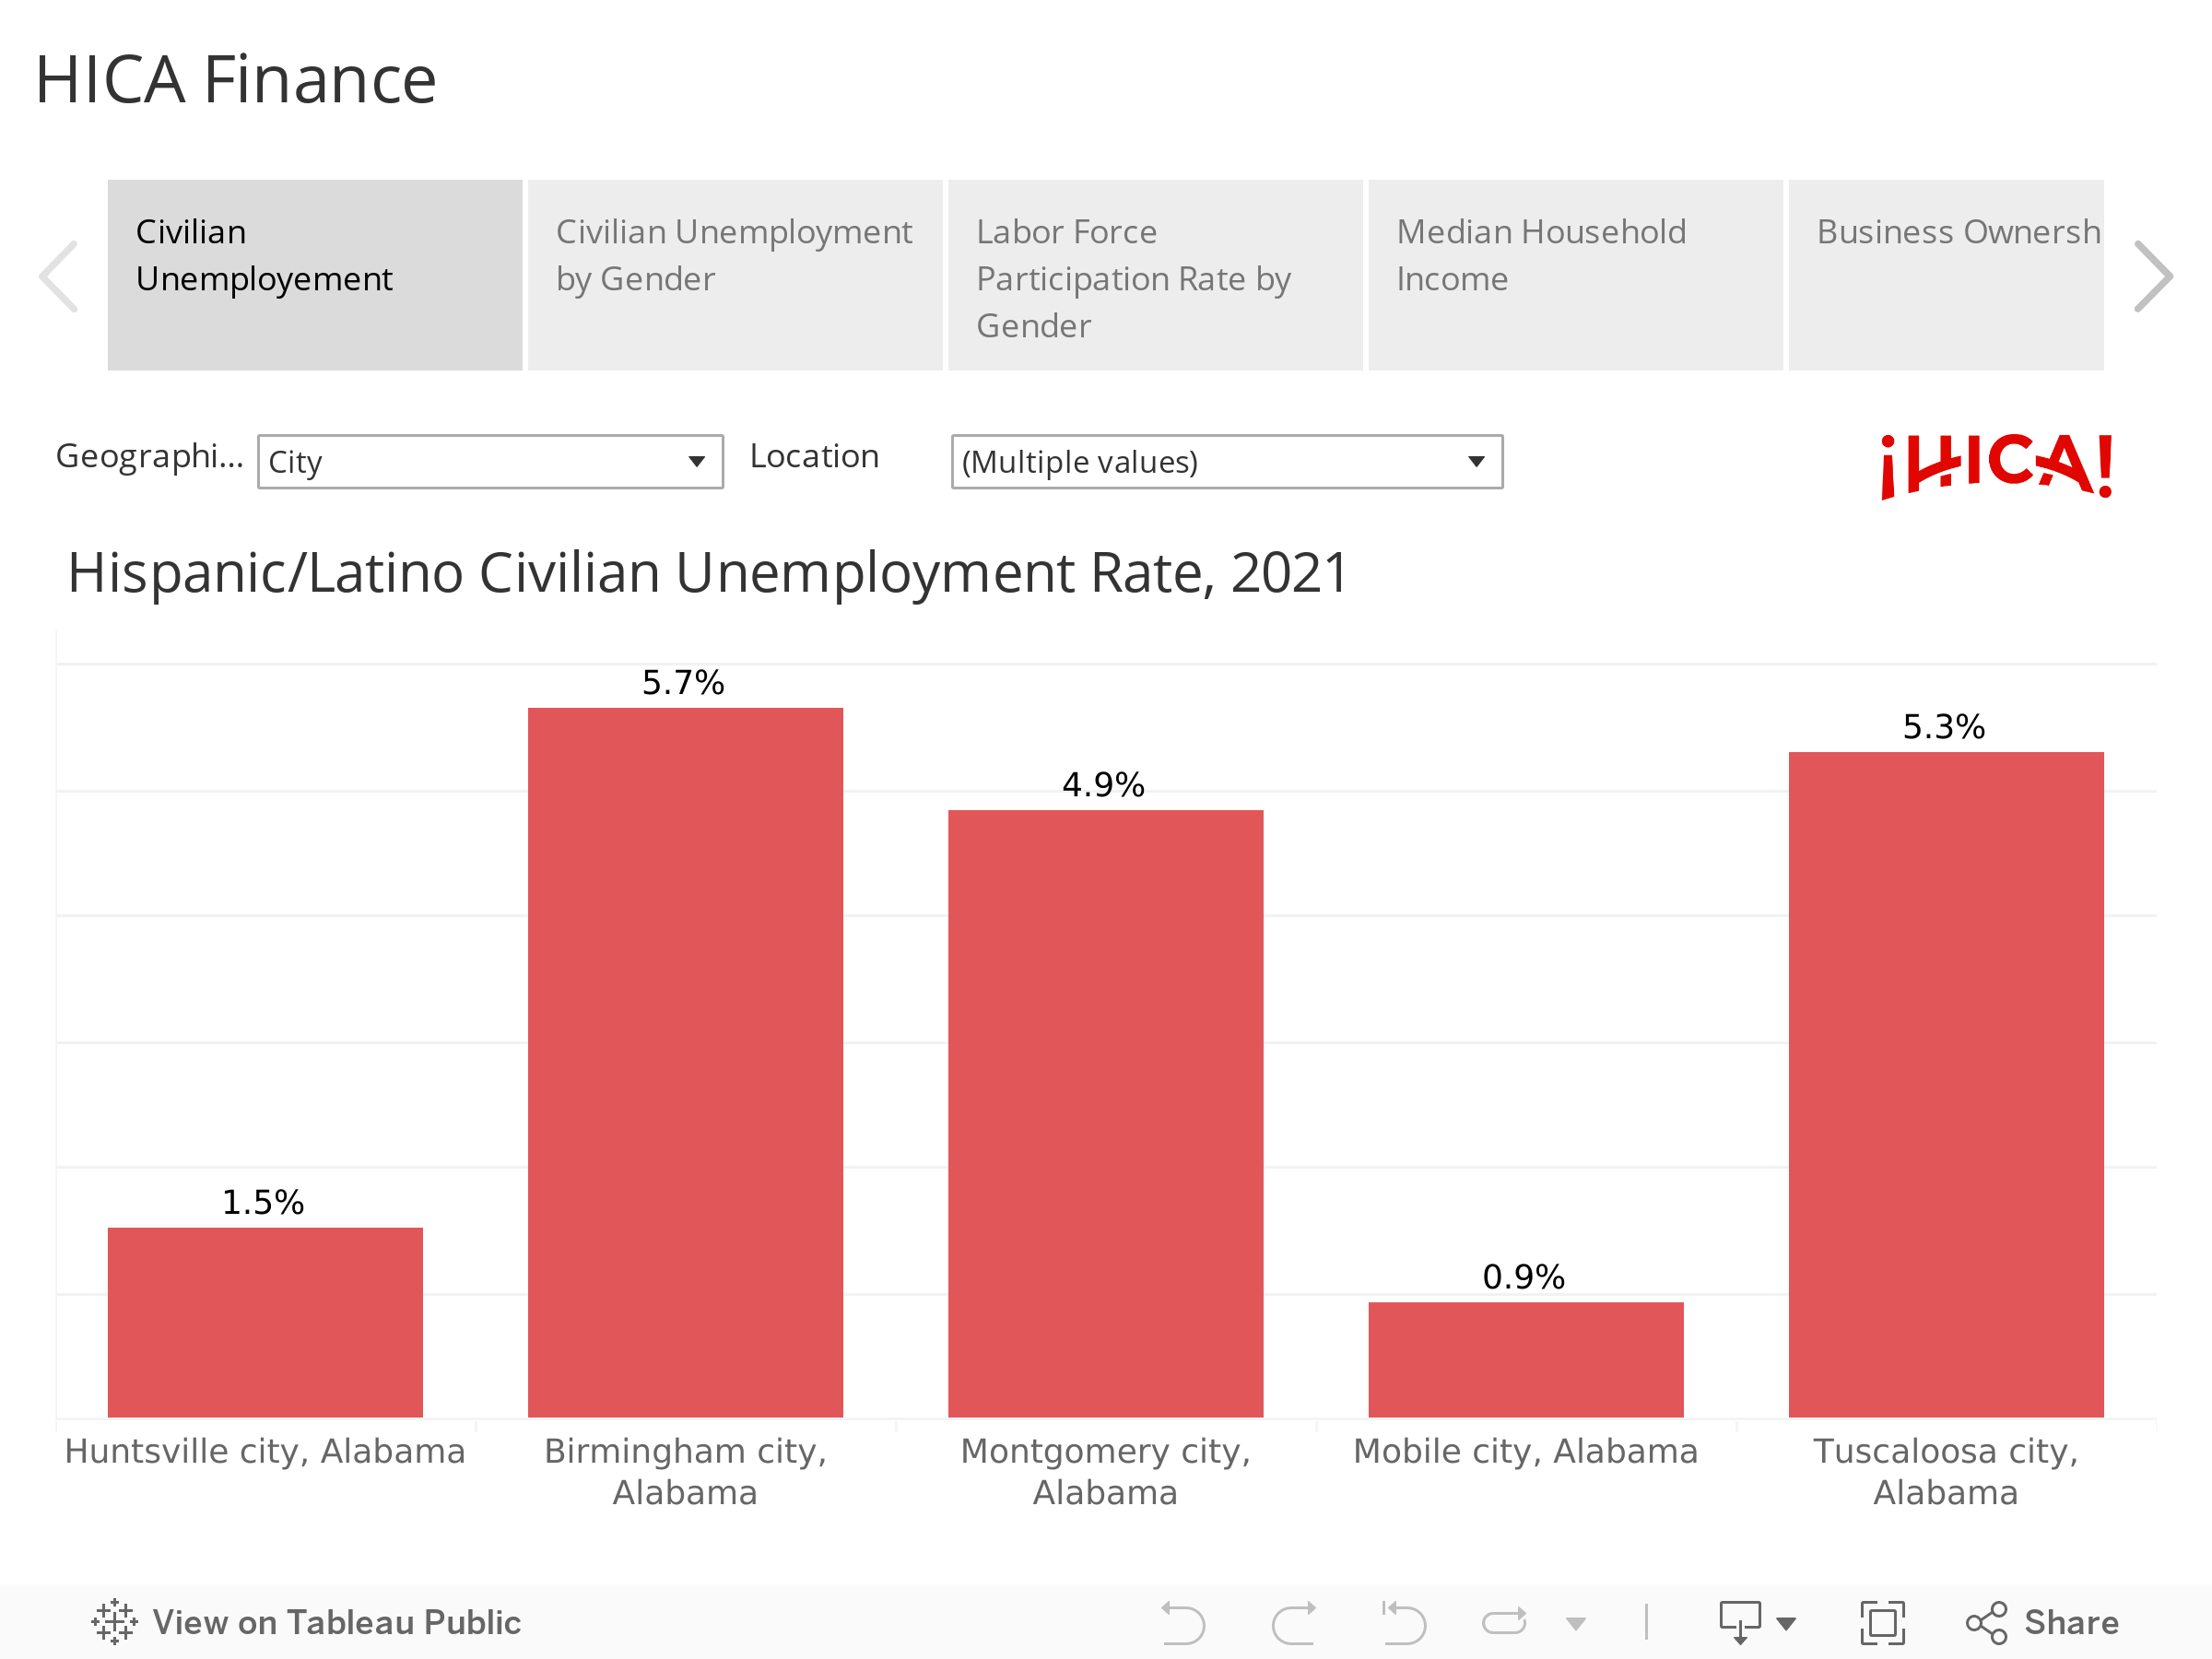
The financial situation of Hispanics and Latinos can only be gleaned by combining many metrics. It requires both personal measures like poverty and income, but also instances of interaction with financial institutions.
Sources: Metrics on unemployment, labor force participation rate, poverty, and median household income are from the Census Bureau’s 2021 American Community Survey 5-Year Detailed Tables. Data on business ownership are from the Census Bureau’s Annual Business Survey 2020. Data on unbanked is from the Federal Deposit Insurance Corporation. Data on home loan denial is from the Federal Financial Institutions Examination Council.
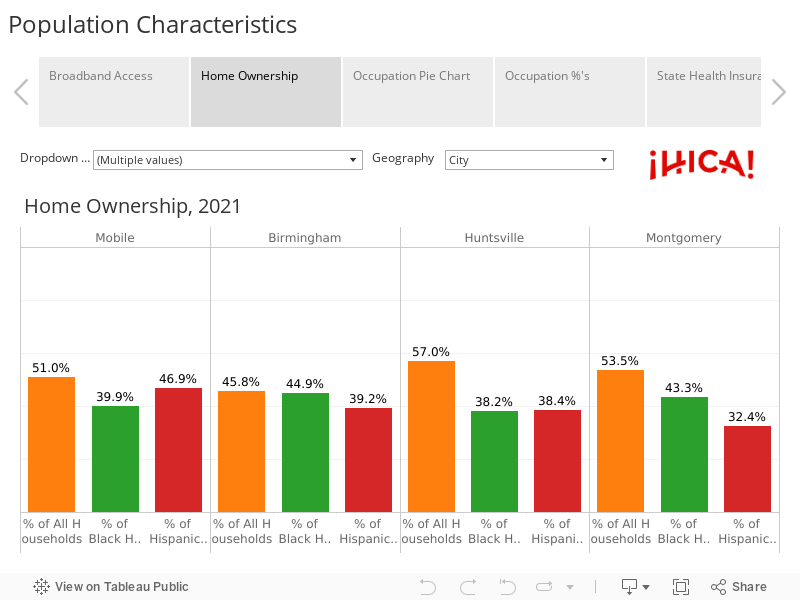
Population Characteristics
The Census Bureau collects an abundant amount of demographic data through multiple surveys on different geographic levels. This data set uses three of them to maximize recency and locality. Through this data, we can glean much about Hispanic and Latino communities. Where they are, how the group is aging, access to health care, etc. There are three dashboards with different aims to display the data: decennial census by age, decennial census’s change over the years, and a broader dashboard of characteristics.
2020 Census by Age
Source: 2020 Decennial Census
2020 Census by Change
Source: 2020 Decennial Census
Population Characteristics
Sources: Data on broadband access, home ownership, occupation, and health insurance come from 2021 ACS 5 Years Detailed Tables. Data on occupation comes from 2021 ACS 1-Year Detailed Tables.
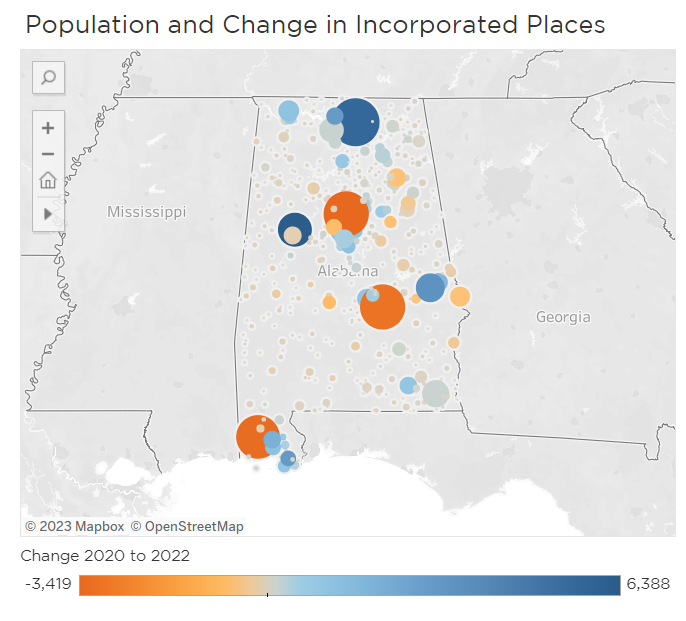
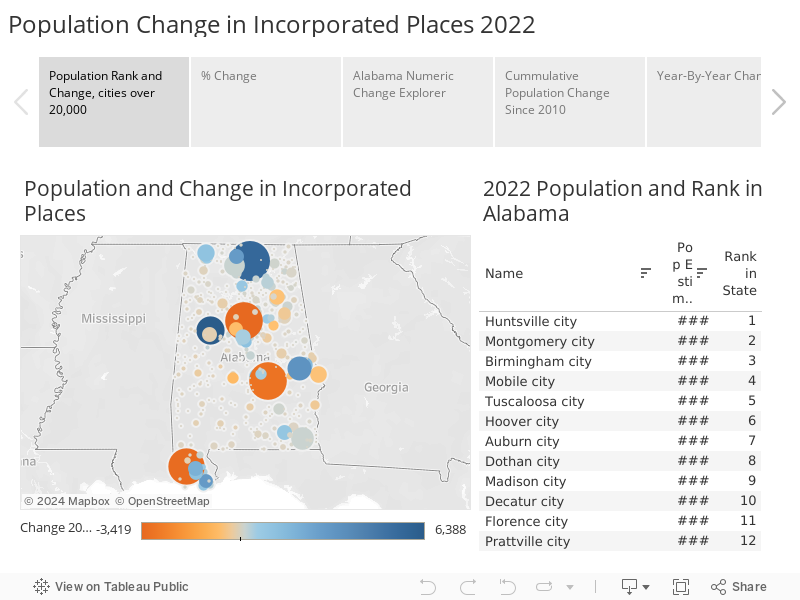
2022 City and MSA Population Estimates
Huntsville continued to surge ahead as Alabama’s three other largest cities lost population to surrounding suburbs. However, the pace of decline slowed in Birmingham and Montgomery, as it did in many cities nationwide that were hit hard by pandemic-driven change.
That’s from the latest estimates produced by U.S. Census Bureau. The estimates cover the period between July 1, 2021, and July 1, 2022, a period during which the effects of the Covid-19 pandemic continued to echo.
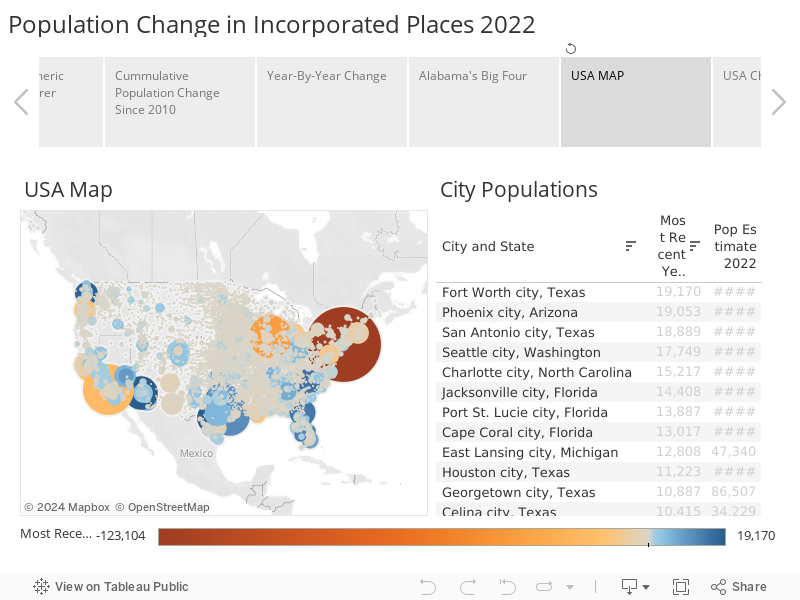
Since the outbreak of the Covid-19 pandemic, many urban centers have seen an erosion in population, both from heightened death rates and outward migration due to changes in work and commuting patterns. In 2022, some central cities began to bounce back, particularly in the South. Nashville and Atlanta returned to population growth.
Meanwhile, other Southeastern cities barely slowed during the pandemic and have since accelerated. Charlotte, N.C., and Jacksonville, Florida, landed in the Top 10 for growth in 2022, along with Florida and Texas cities.
Alabama’s Four Large Cities
As the 2020 Census approached, the state’s four largest cities had converged at about 200,000 residents each. As the cities have changed ranks, population trends have become increasingly closely watched. (Coverage by Al.com).
Long the state’s largest city, Birmingham’s population peaked in 1960 at 340,000. After 1960, almost all Birmingham-area residential growth occurred in surrounding suburbs rather than the city. A downtown urban residential renaissance in recent years hasn’t been enough to offset the shift to newer housing farther from the city center. According to the estimates, Birmingham is now the third largest city, behind Huntsville and Montgomery. However, Birmingham’s urban core remains larger, and its metro area is more than twice as large as Huntsville.
Meanwhile, Huntsville’s population growth has been spurred by both private and public defense and technology investment, as well as by the successful recruitment of manufacturers like Mazda-Toyota and Polaris. And unlike Birmingham, Huntsville has been able to add population because it strategically annexed land where residential and job growth is taking place. Instead of being surrounded by a ring of suburbs, Huntsville now encircles its largest suburb, Madison.
When looking at groupings of urban counties known as metropolitan statistical areas (MSAs), the state’s largest MSA, Birmingham-Hoover, saw a population decline according to the estimates. Data released earlier showed that growth in Shelby and St. Clair County didn’t offset the larger out-migration from Jefferson County and the elevated rate of death rate experienced in Jefferson County. In the new 2022 estimates, most of the inner ring of Birmingham suburbs also showed a population decline, with the growth concentrated farther from the city center. Mobile, Gadsden, and Columbus, GA-AL MSAs also saw declines. The rest of the state’s MSAs posted population gains.
A cluster of north Alabama MSAs — Huntsville (Limestone and Madison County), Decatur (Morgan County), and the Shoals (Colbert and Lauderdale Counties) — saw the most growth. In percentage terms, Baldwin County MSA grew the fastest.
Growth in Smaller Cities
Most of the population growth occurred outside of the big four cities. Tuscaloosa and Auburn-Opelika continued to see population increases. Tuscaloosa has seen Alabama’s most significant bump in its total population since the 2020 Census. Part of the rise in the numbers was due to what amounted to a recount. Tuscaloosa successfully argued that the 2020 Census undercounted the city’s population since most students had left for home during those early days of the pandemic. After considering new data, the Census Bureau now counts Tuscaloosa’s population at over 110,000, more than 10,000 residents higher than the 2020 estimates base.
Huntsville neighbors Madison and Athens were among the big gainers, as were more distant neighbors in its orbit like Cullman, Florence, and Muscle Shoals.
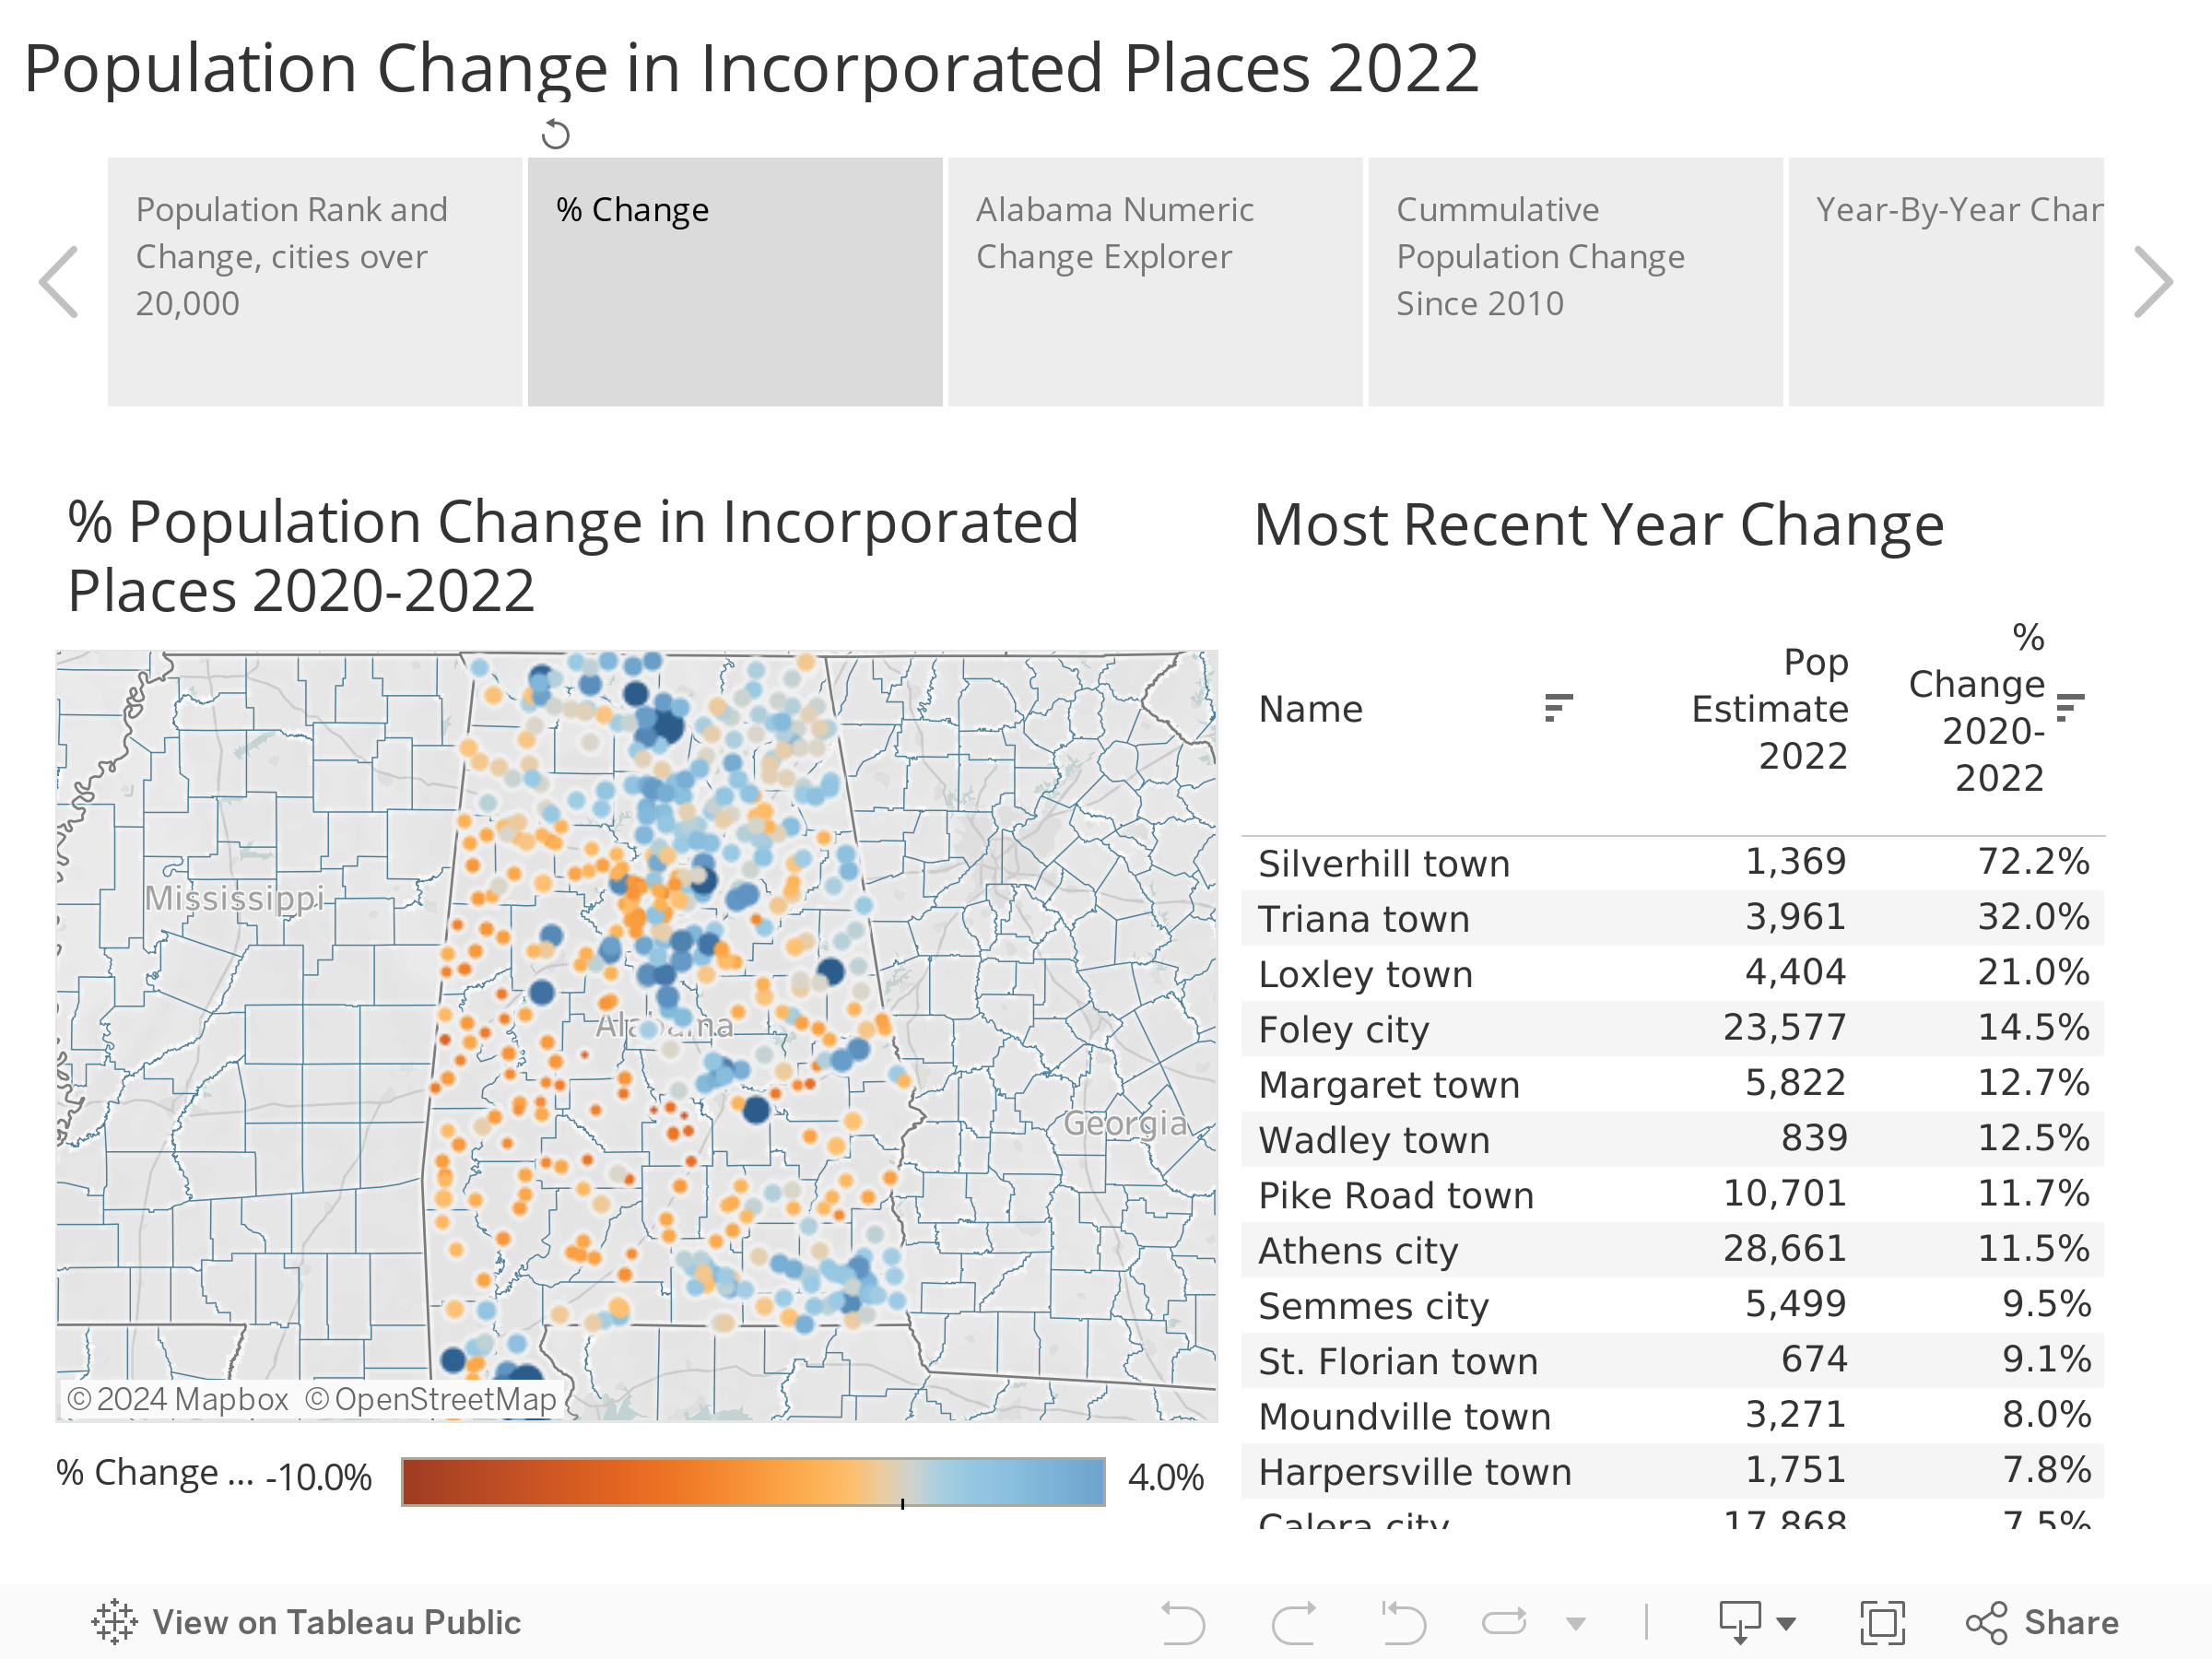
Baldwin County’s growth is widespread to the south, with several cities — Foley, Daphne, Fairhope, Gulf Shores, and Loxley — among the top 20 for growth in Alabama cities.
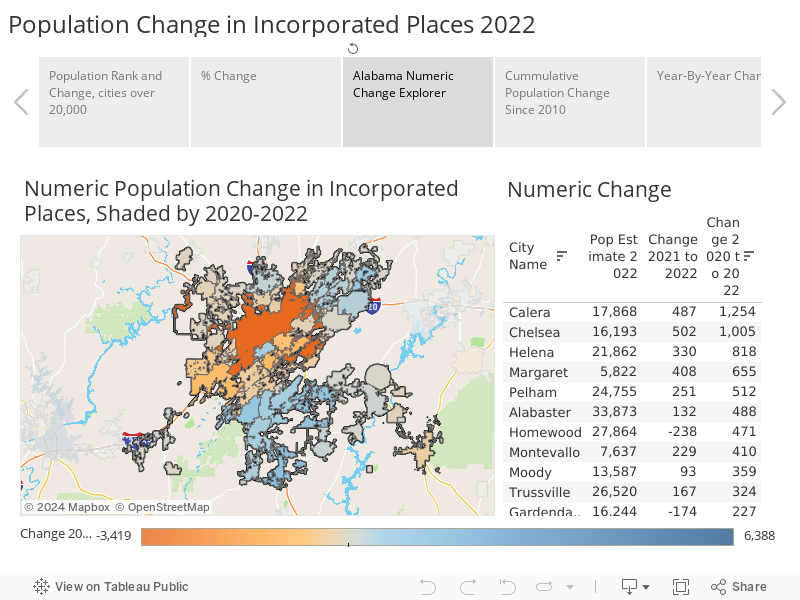
The most recent estimates showed close-in Birmingham suburbs Vestavia Hills, Homewood, Mountain Brook, and even Hoover as declining in population. The high cost of houses and short supply in the already-developed suburbs has likely affected the trajectory of population levels in those communities. Meanwhile, newer suburbs farther afield, like Helena, Chelsea, and Calera, continue to see growth.
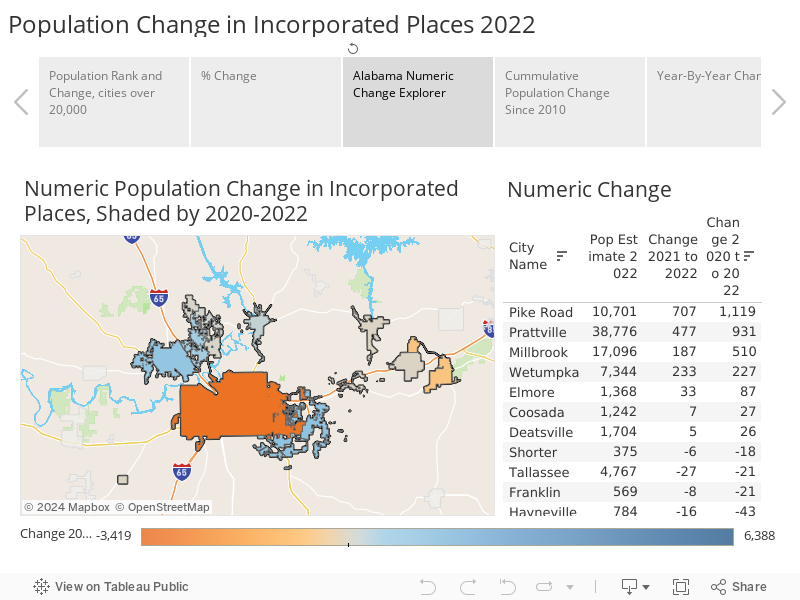
Montgomery, which was long the only sizeable city in Montgomery County, is seeing population growth in its relatively new neighbor, Pike Road, which has added more than 1,000 new residents since 2020. Prattville is seeing similar growth levels.
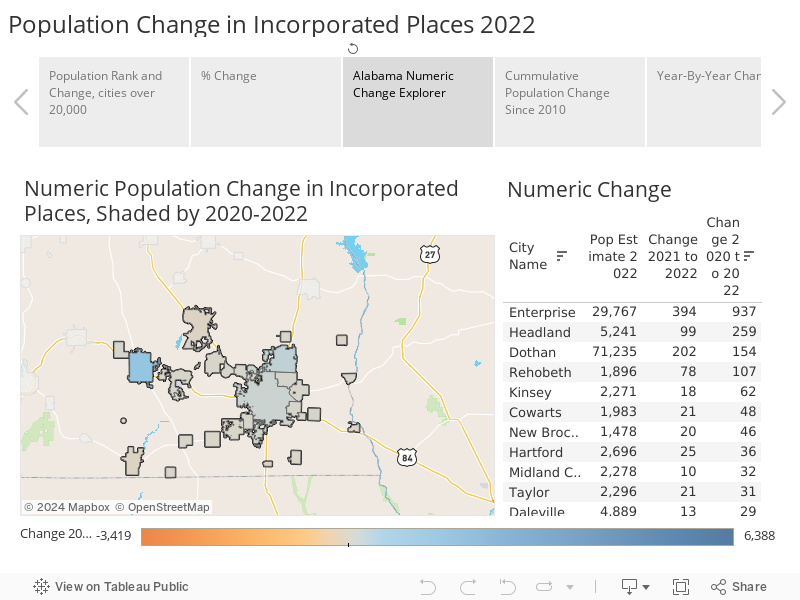
The population is growing modestly in Wiregrass communities, the biggest gainer being Enterprise which has added about 1,000 residents since 2020.
Cities surrounding Anniston and Gadsden have continued to see very modest population changes.
Across Alabama, about 55% of cities lost population in the most recent year. Wide swaths of rural Alabama, particularly in the west and central part of the state, are experiencing population decline. Only 50 cities statewide out of 460 added 100 people or more between July 1, 2021, and July 1, 2022, according to the estimates.
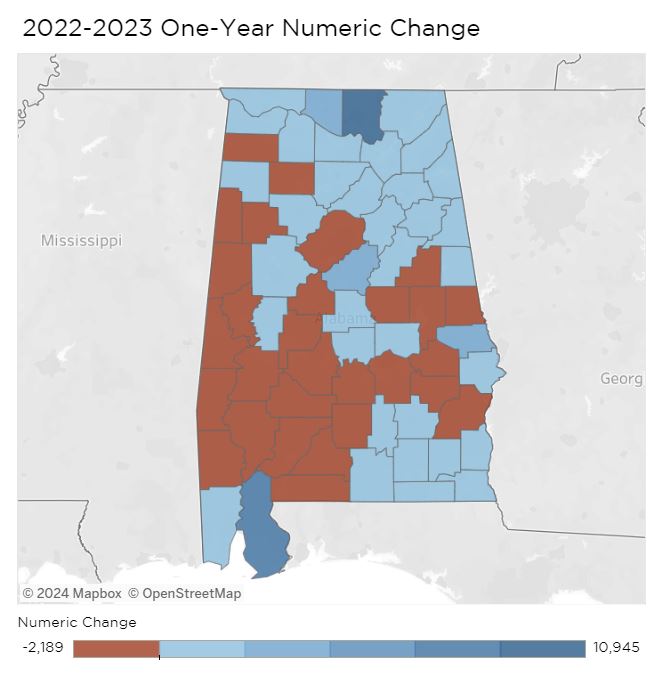
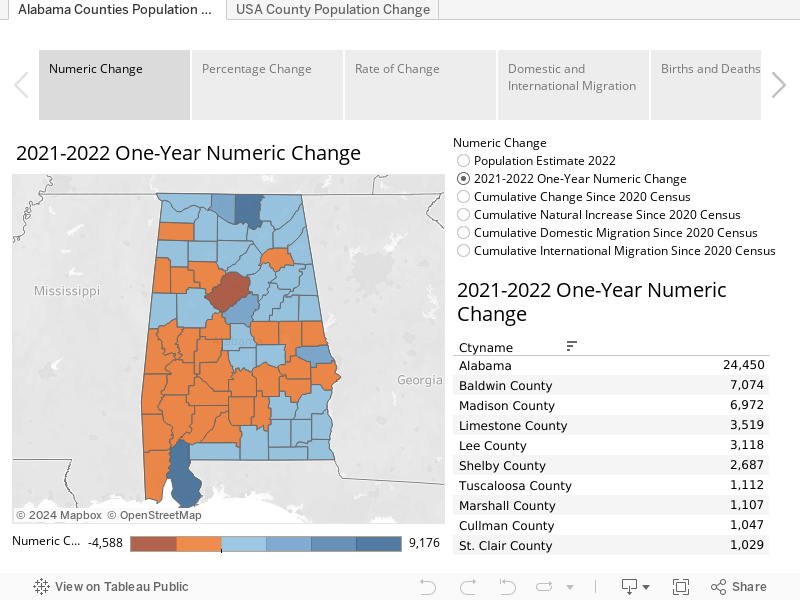
Most Alabama Counties Grew in 2022, Reversing Trend
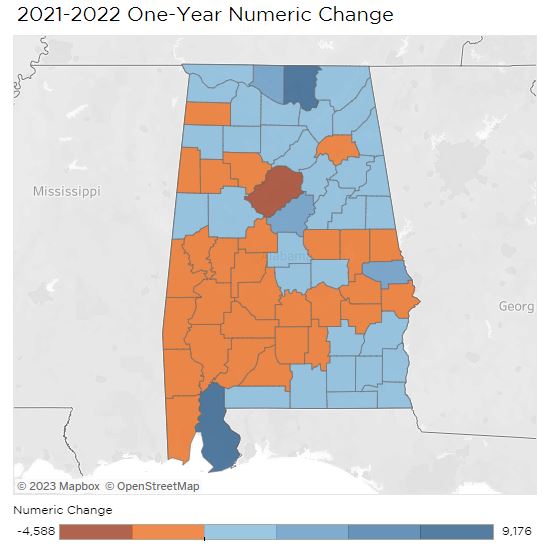
People are moving to Alabama, and according to most recent population estimates, the growth is more widespread than it has been. Out of 67 counties, 36 saw population growth between July 1, 2021, and July 1, 2022, the period covered in the latest Census Bureau release. In the prior year, only 29 counties saw positive growth. Throughout the 2010s, only 24 counties grew.
Fig. 1. Numeric Change 2021-2022
The growth is particularly noteworthy because four factors were putting downward pressure on population growth:
Death rates were still elevated in the wake of the Covid-19 pandemic
The large Baby Boom generation is entering years of increased mortality
Smaller succeeding generations have lower birthrates
International immigration is still lower than historical norms
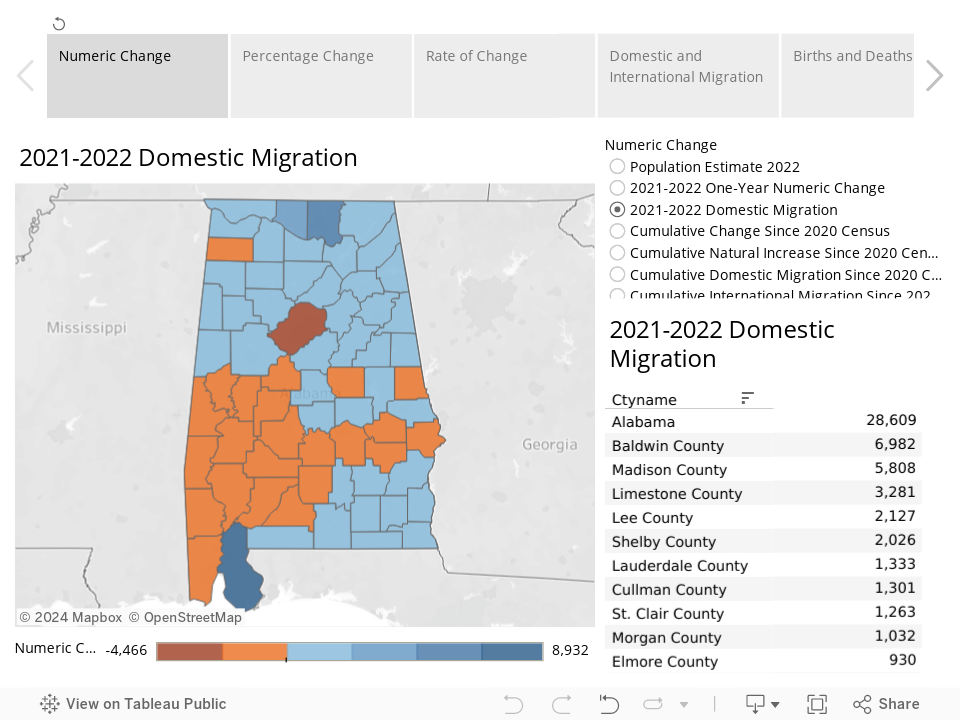
But in the counties that grew, and for the state as a whole, domestic migration — a net positive number of U.S. residents moving into the state — overcame the headwinds.
Fig. 2 Domestic Migration 2021-2022
The strongest growth was among the usual suspects: Baldwin County in the south and Madison and Limestone counties in the north, with Lee, Shelby, and Tuscaloosa counties also continuing positive growth trends. The Huntsville area’s growth continues to spread across North Alabama, with population growth accelerating in The Shoals (Lauderdale and Colbert), Cullman, Morgan, and Marshall counties.
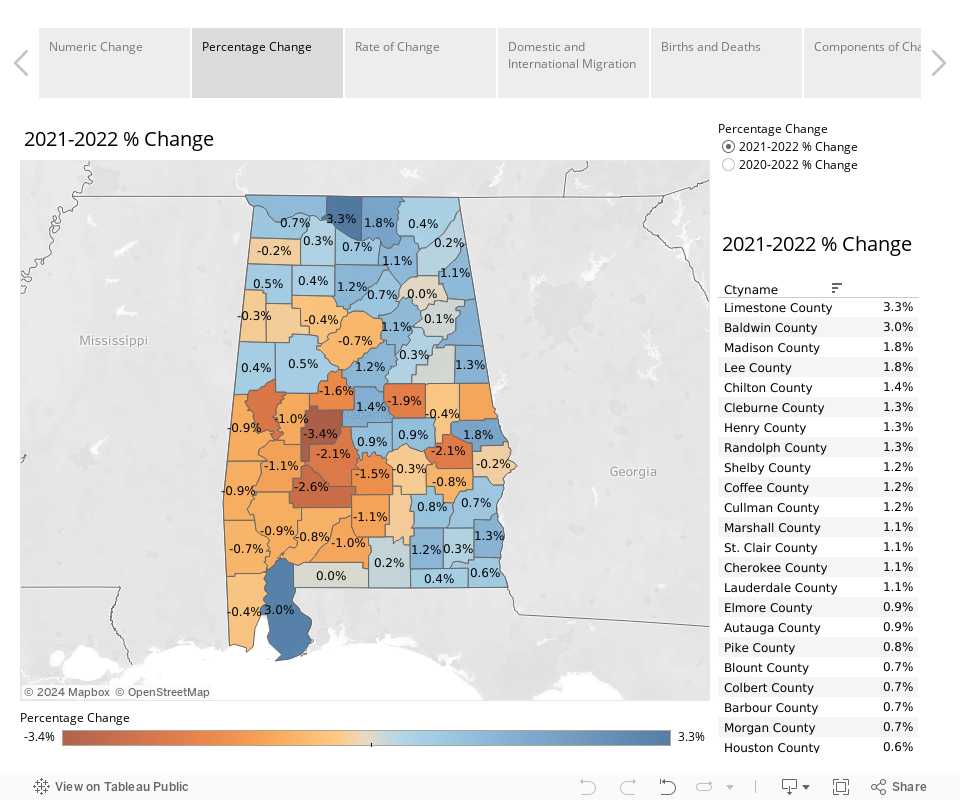
The Wiregrass and Northeast Alabama counties also grew, including Calhoun County, which had been on an extended population losing streak. Calhoun added over 600 new residents through domestic migration for a net population gain of 111. Etowah County attracted 524 new residents, but since deaths exceeded births, the population total declined slightly, down just 55 residents.
In percentage terms, Limestone County grew the fastest. That’s likely growth not only in Athens, the county seat, but also from Huntsville and Madison, which have spread from Madison County into Limestone. Generally, counties along the Interstate corridors are growing, as well as counties bordering Tennessee, Georgia, and Florida. On the western border with Mississippi, most counties are losing population.
Urban losses
Alabama’s traditional urban centers — Jefferson, Montgomery, and Mobile — lost population, primarily due to domestic outmigration.
That population loss parallels national trends among urban counties: in the wake of the pandemic, most population centers lost population. According to the estimates, Jefferson County’s population decreased 4,588 in 2022. Since the 2020 Census, Jefferson County’s population has decreased by almost 9,000.
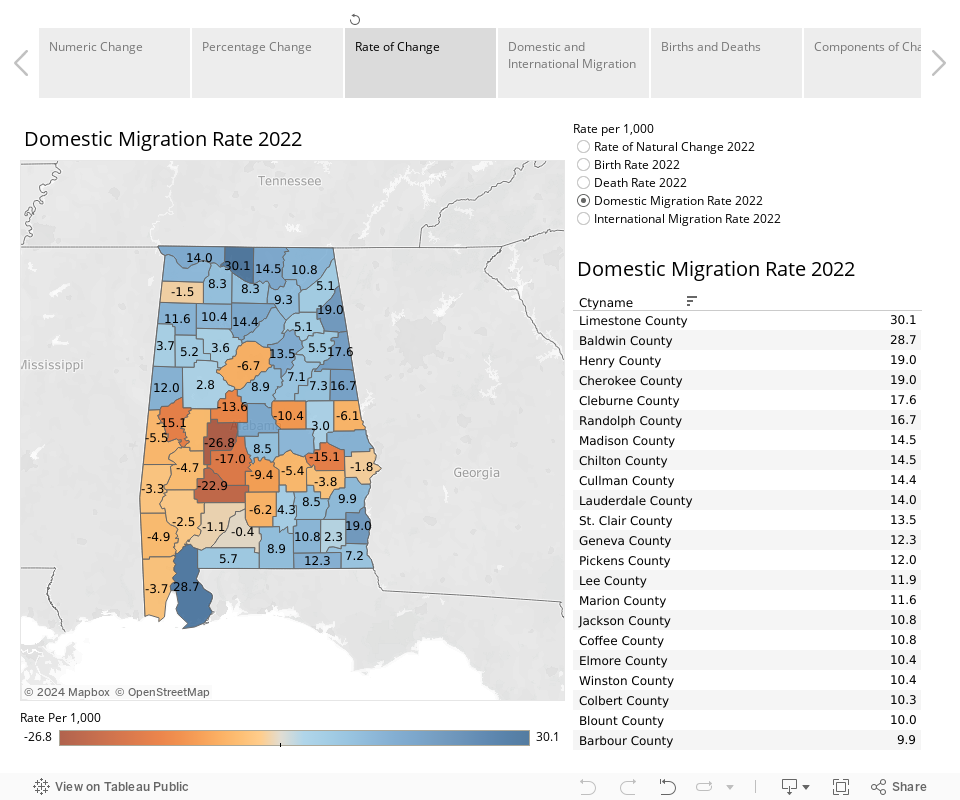
Rate of Domestic Migration, 2021-2022
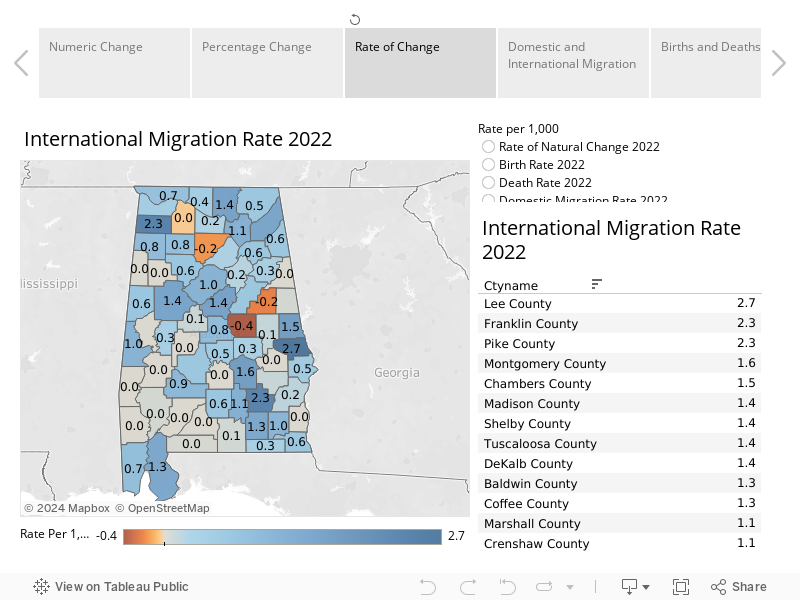
There are signs of a turnaround, though. Nationally, large urban centers began seeing population recovery in 2022. Jefferson County’s population loss was lower in 2022 than in 2021. International immigration and natural increase helped fuel population growth in urban centers elsewhere, including among Southern neighbors. Alabama’s big cities saw some population growth through international immigration. However, Alabama generally sees much lower rates of international in-migration.
Rate of International Migration, 2021-2022
Divergent Rates of Change
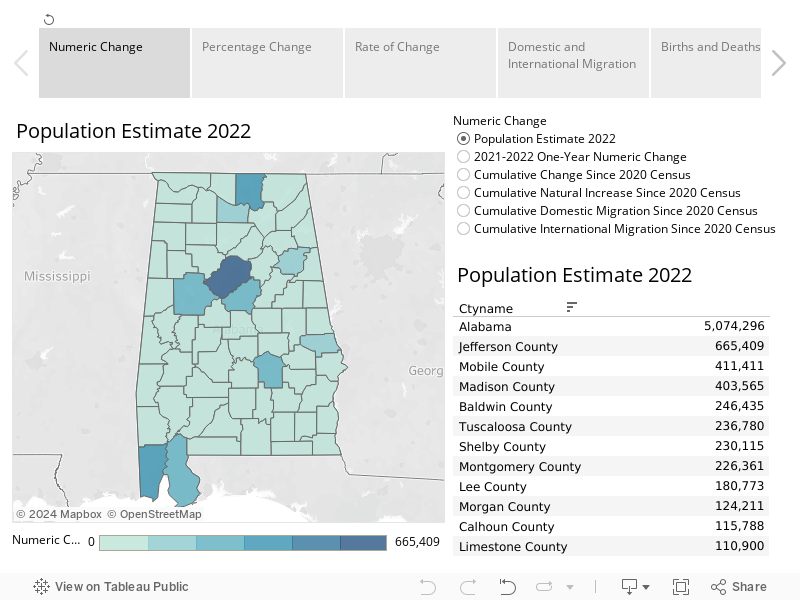
Alabama’s Black Belt and other more remote rural counties continued to lose population through residents moving away and through higher death rates. According to the estimates, Lowndes, Perry, and Greene Counties are each now below 10,000 in population, with Greene being the least populous at 7,422. Bullock, Coosa, and Wilcox are close to 10,000. Nationally, about 1,000 of the more than 3,000 counties in the U.S. have 10,000 or fewer residents.
Population Estimates, 2022, U.S. Census Bureau
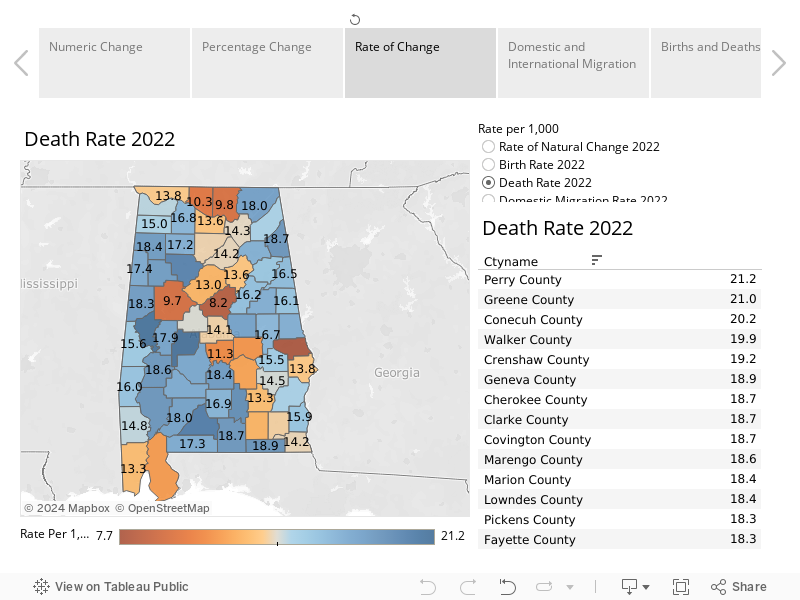
In addition to outmigration, rural counties tend to have negative rates of natural change: in other words, more deaths than births. Those counties tend to have a higher median age, with a higher share of the population over 60. That’s a population that has an increased risk of death from natural causes.
Rate of Death, 2021-2021
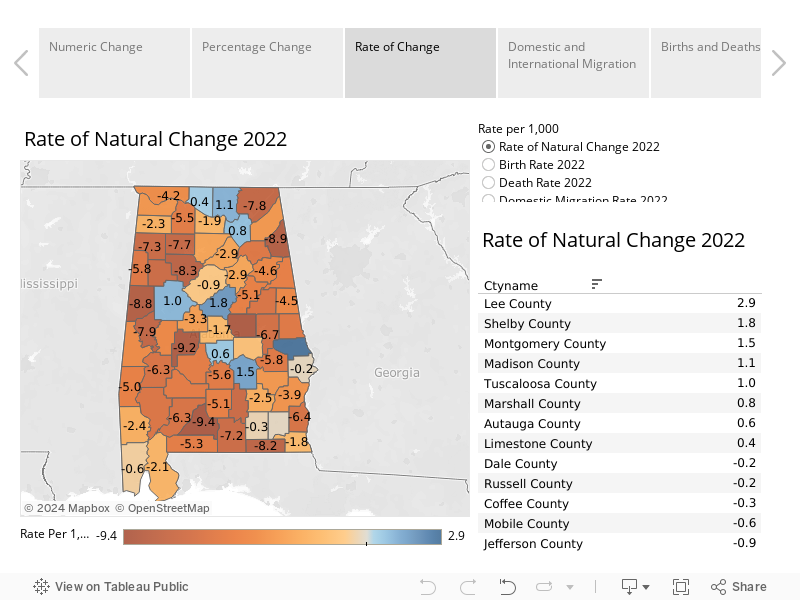
On the opposite end of the spectrum are counties with a higher proportion of the population who are young adults or in their child-bearing years. In only eight counties have births outnumbered deaths since 2020: Lee, Shelby, Madison, Montgomery, Tuscaloosa, Limestone, Marshall, and Autauga.
Alabama’s population change is occurring in the context of national trends that are visible when zoomed out to the national level. Population losses in Alabama’s Black Belt are connected to patterns along the Mississippi River from Mississippi and Louisiana, Arkansas, Missouri, and even Illinois. Baldwin County’s growth rate has echoes along the coasts of Florida, Georgia, and North and South Carolina coasts. Huntsville’s growth sits at the edge of the mountain interior southern region stretching across Tennessee, North and South Carolina, and Northern and Central Georgia.
Who Cares About Childcare? PARCA Annual Forum, 2023
Gov. Kay Ivey identified affordable and high-quality child care as a key priority in her speech to the Public Affairs Research Council’s Annual Forum, held Friday, March 10, at the Harbert Center in Birmingham.
“Many Alabamians and others across the country face a dilemma in finding safe, reliable childcare,” Ivey told the crowd of close to 400, “As more and more Alabamians join the workforce, which is a very positive development for our state and quality of life, more working families will also be in need of childcare services. There is no better time than right now to address this fundamental need facing this state.”
Friday’s Forum featured researchers, parents, childcare providers, and employers discussing the state’s challenges in fostering an adequate supply of affordable, convenient, and high-quality care for young children and their working parents.
Below you can find the program for the event, which includes biographies of the featured speakers.
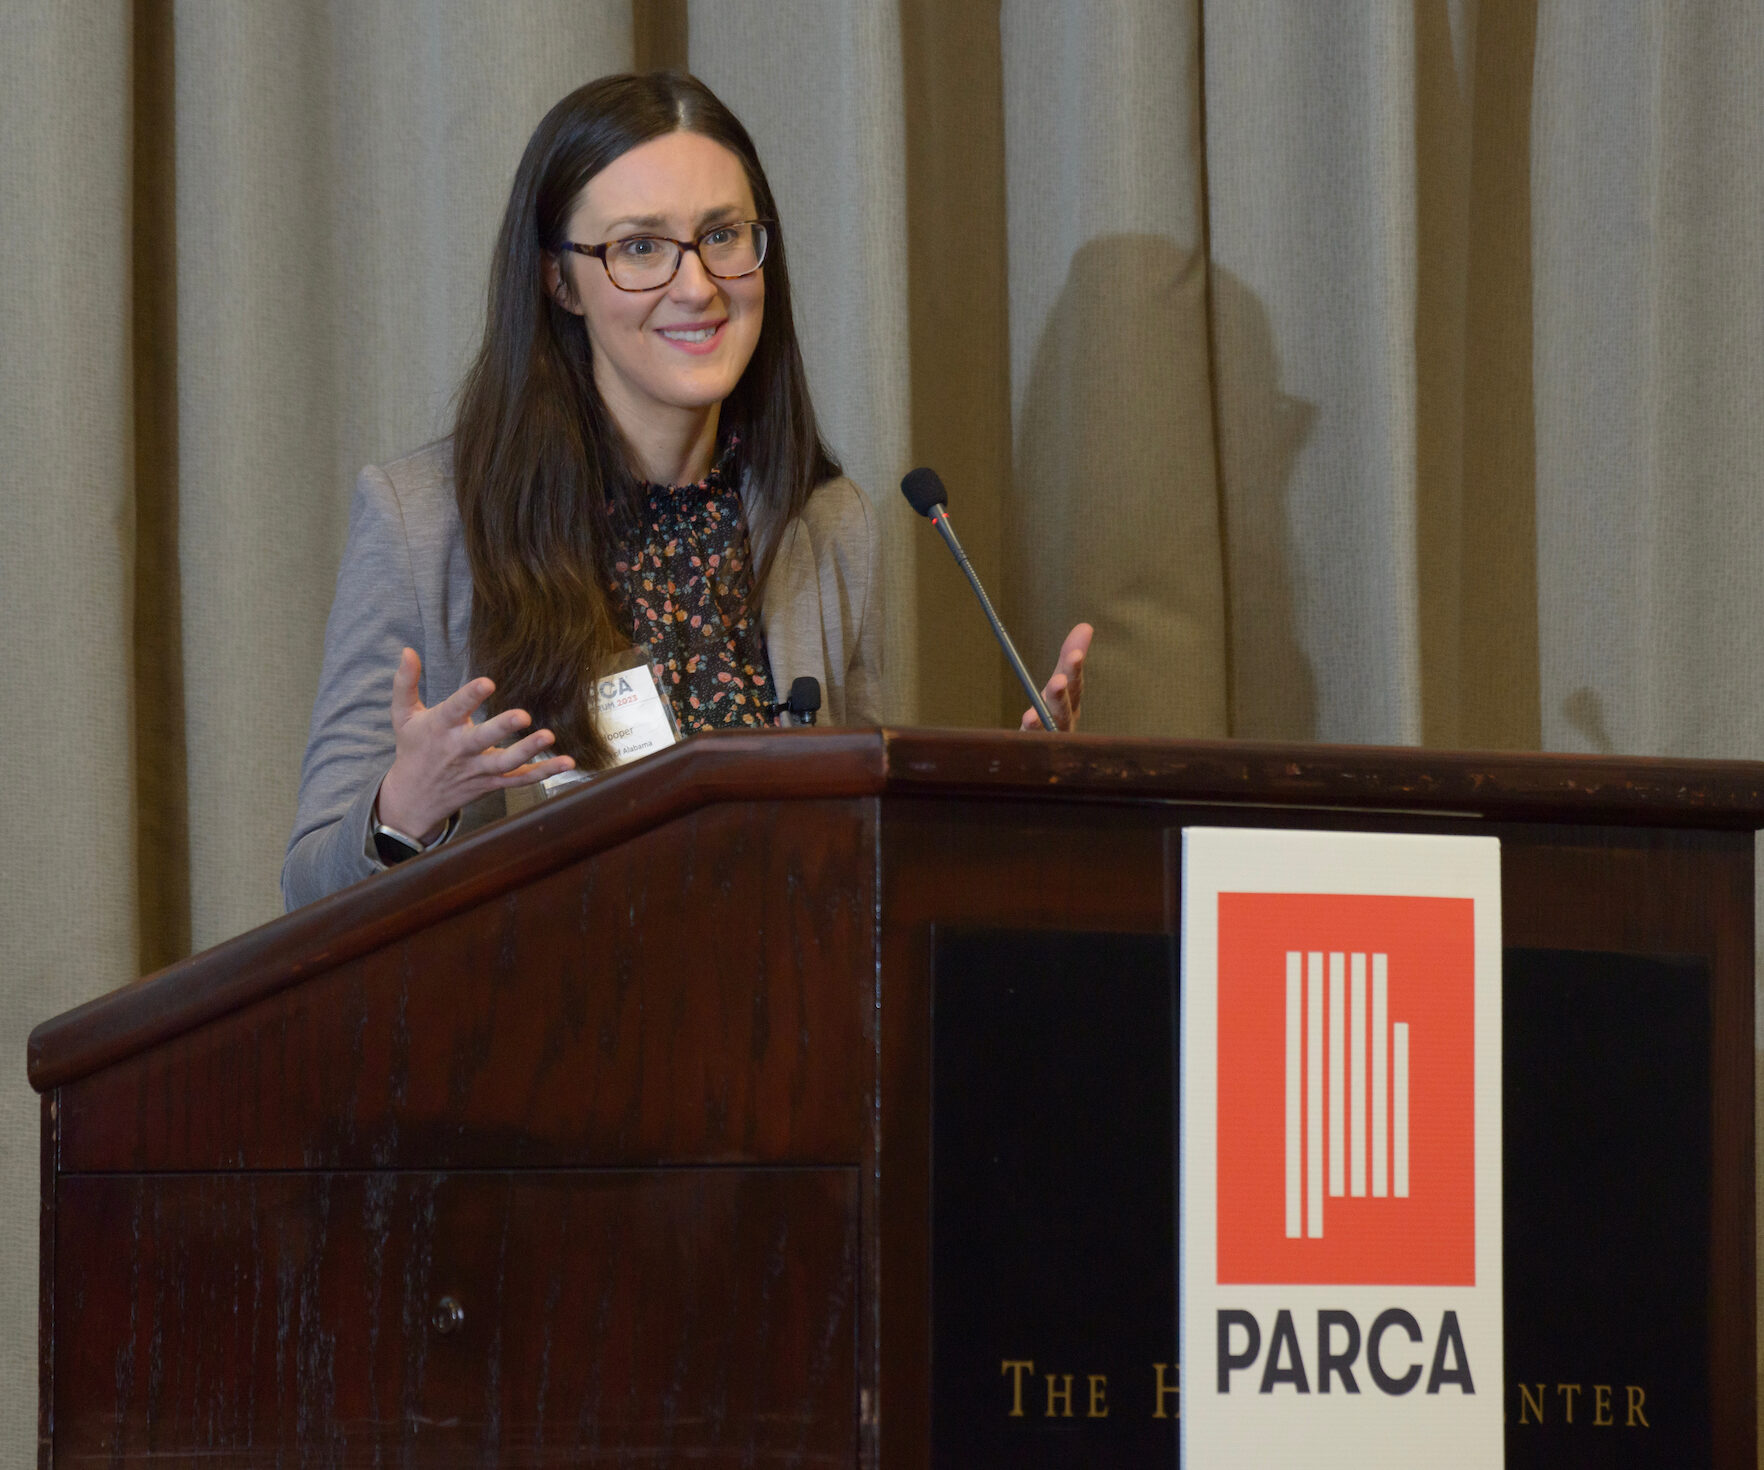
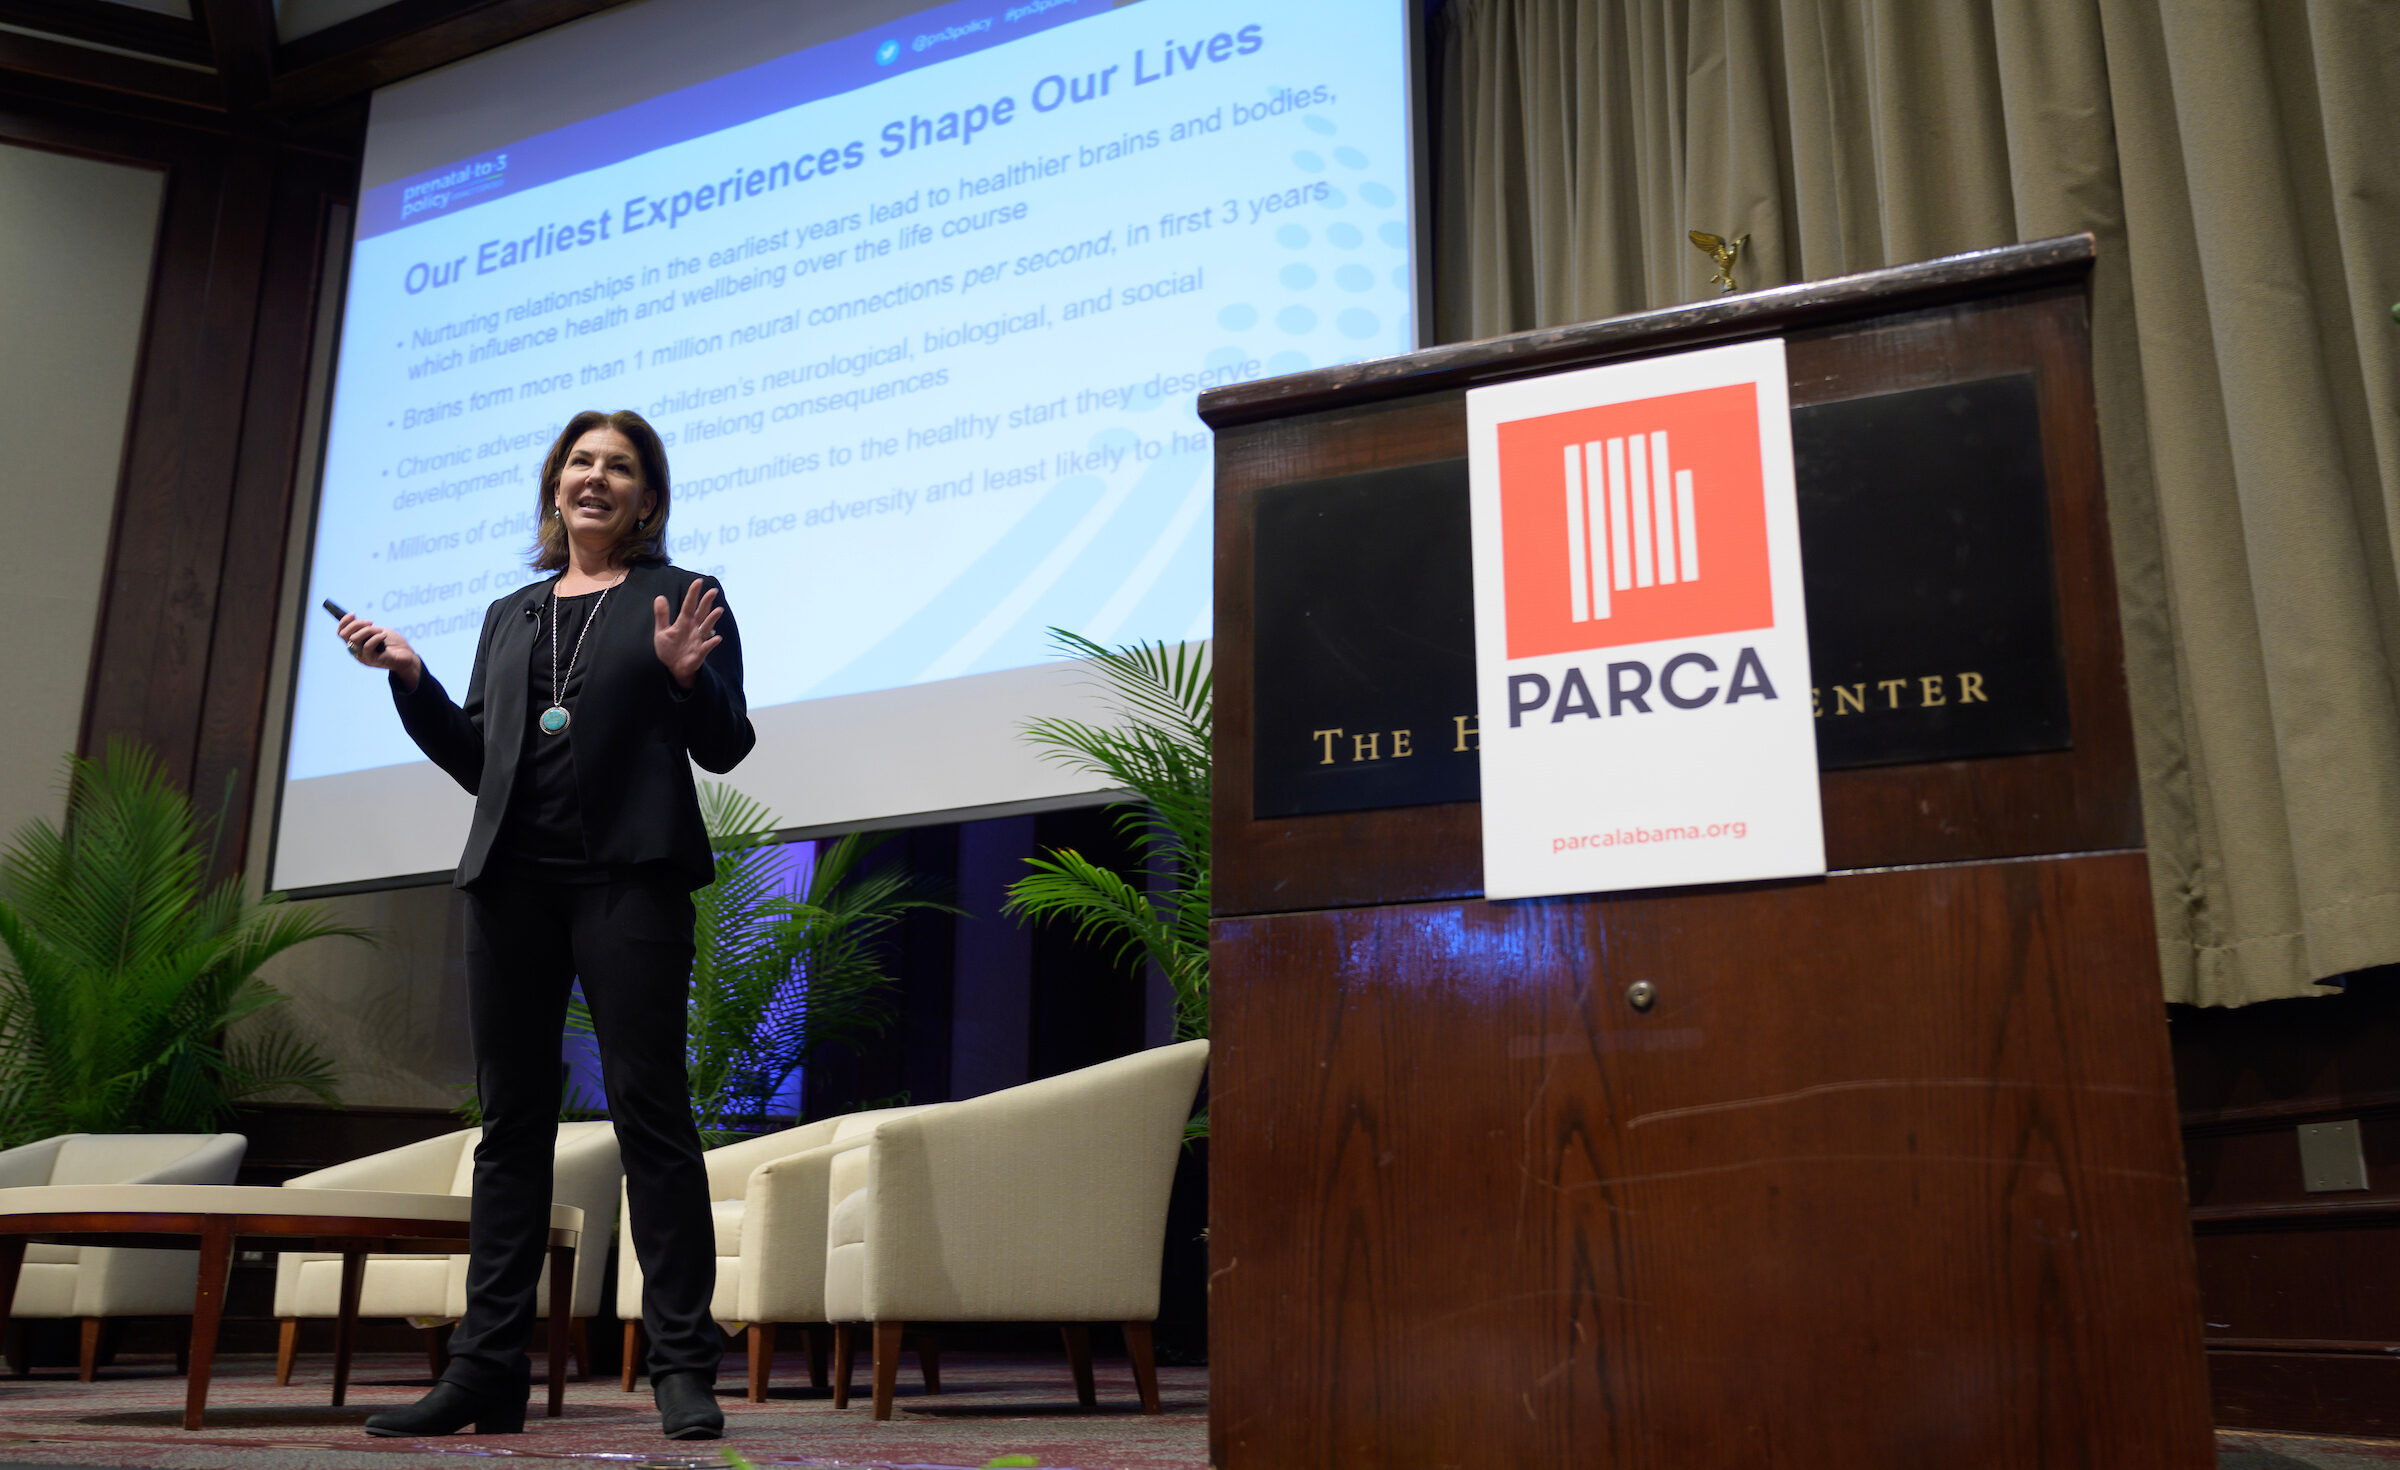
Speakers included Alison Hooper, an assistant professor of early childhood education at the University of Alabama’s College of Education, whose research has mapped childcare availability and access across the state, and Cynthia Osborne, the executive director of the Prenatal-to-3 Policy Impact Center and professor of Early Childhood Education and Policy at Vanderbilt University’s Peabody College of Education and Human Development.
Osborne’s center has developed a 50-state comparison of key policies that relate to childcare, plus statistical comparisons of child well-being and policy options for delivering additional support to children and families. That includes a summary of findings for each state, including Alabama.
Both presentations are embedded below.
UA Assistant Professor of early childhood education addresses the PARCA Annual Forum, March 10, 2023
The Forum also included a panel facilitated by Janina Nobles, Child Development Instructor and Program Advisor at Bevill State Community College. The panel included a collection of parents, a childcare provider, and an employer to provide a range of perspectives on the issues happening in childcare.
Alabama’s Population Growth Driven by Changing Factors
Alabama’s population grew faster in 2022 than in any year in more than a decade, with changing factors producing the growth, according to estimates generated by the U.S. Census Bureau.
The data, released in December, covers the period between July 1, 2021, and July 1, 2022. The Census Bureau estimates that Alabama grew by 24,450 or 0.5% over the period. That growth rate ranks No. 20 nationally and is ahead of Mississippi and Louisiana but behind Southeastern neighbors like Tennessee and the southern states on the East Coast.
Changing factors
From 2010-2017, Alabama grew slowly, with natural change (births minus deaths) and international migration (migrants arriving from another country) providing slow but positive growth.
Since then, factors have flipped. With the arrival of Covid-19, the number of deaths jumped. Natural change has gone negative, with more people dying than being born. While mortality from Covid will decline, the death rate is expected to remain elevated as the large population cohort known as the Baby Boom ages and moves into years of increased mortality.
Meanwhile, with changes to immigration policy during the Trump administration and with restrictions imposed during the pandemic, international immigration contracted. However, for Alabama, the contraction in international migration was offset by a surge in domestic migration: more people moving to Alabama from other U.S. states.
Rates of Change
As part of its data release, the Census Bureau calculates rates of change for the basic factors of population change. The rates are calculated by estimating the change and then adjusting for population.
Alabama ranks 16th in domestic migration in 2022, but 48th in international immigration.
Alabama’s birth rate was slightly above the U.S. average in 2022, but claims the 5th highest death rate among U.S. states
Conclusion
Alabama is growing, though not as fast as some of its Southeastern neighbors. Alabama’s high death rate indicates that underlying health challenges and disparities in healthcare access likely contributed to a higher mortality rate. Domestic immigration shows strength, indicating that the state is attracting new residents from other states. However, international immigration rates are lower in Alabama.
Estimates for counties, cities, and metro areas will be released later this year. Those estimates will provide further insight into where people are moving within the state and how other factors affect population change.
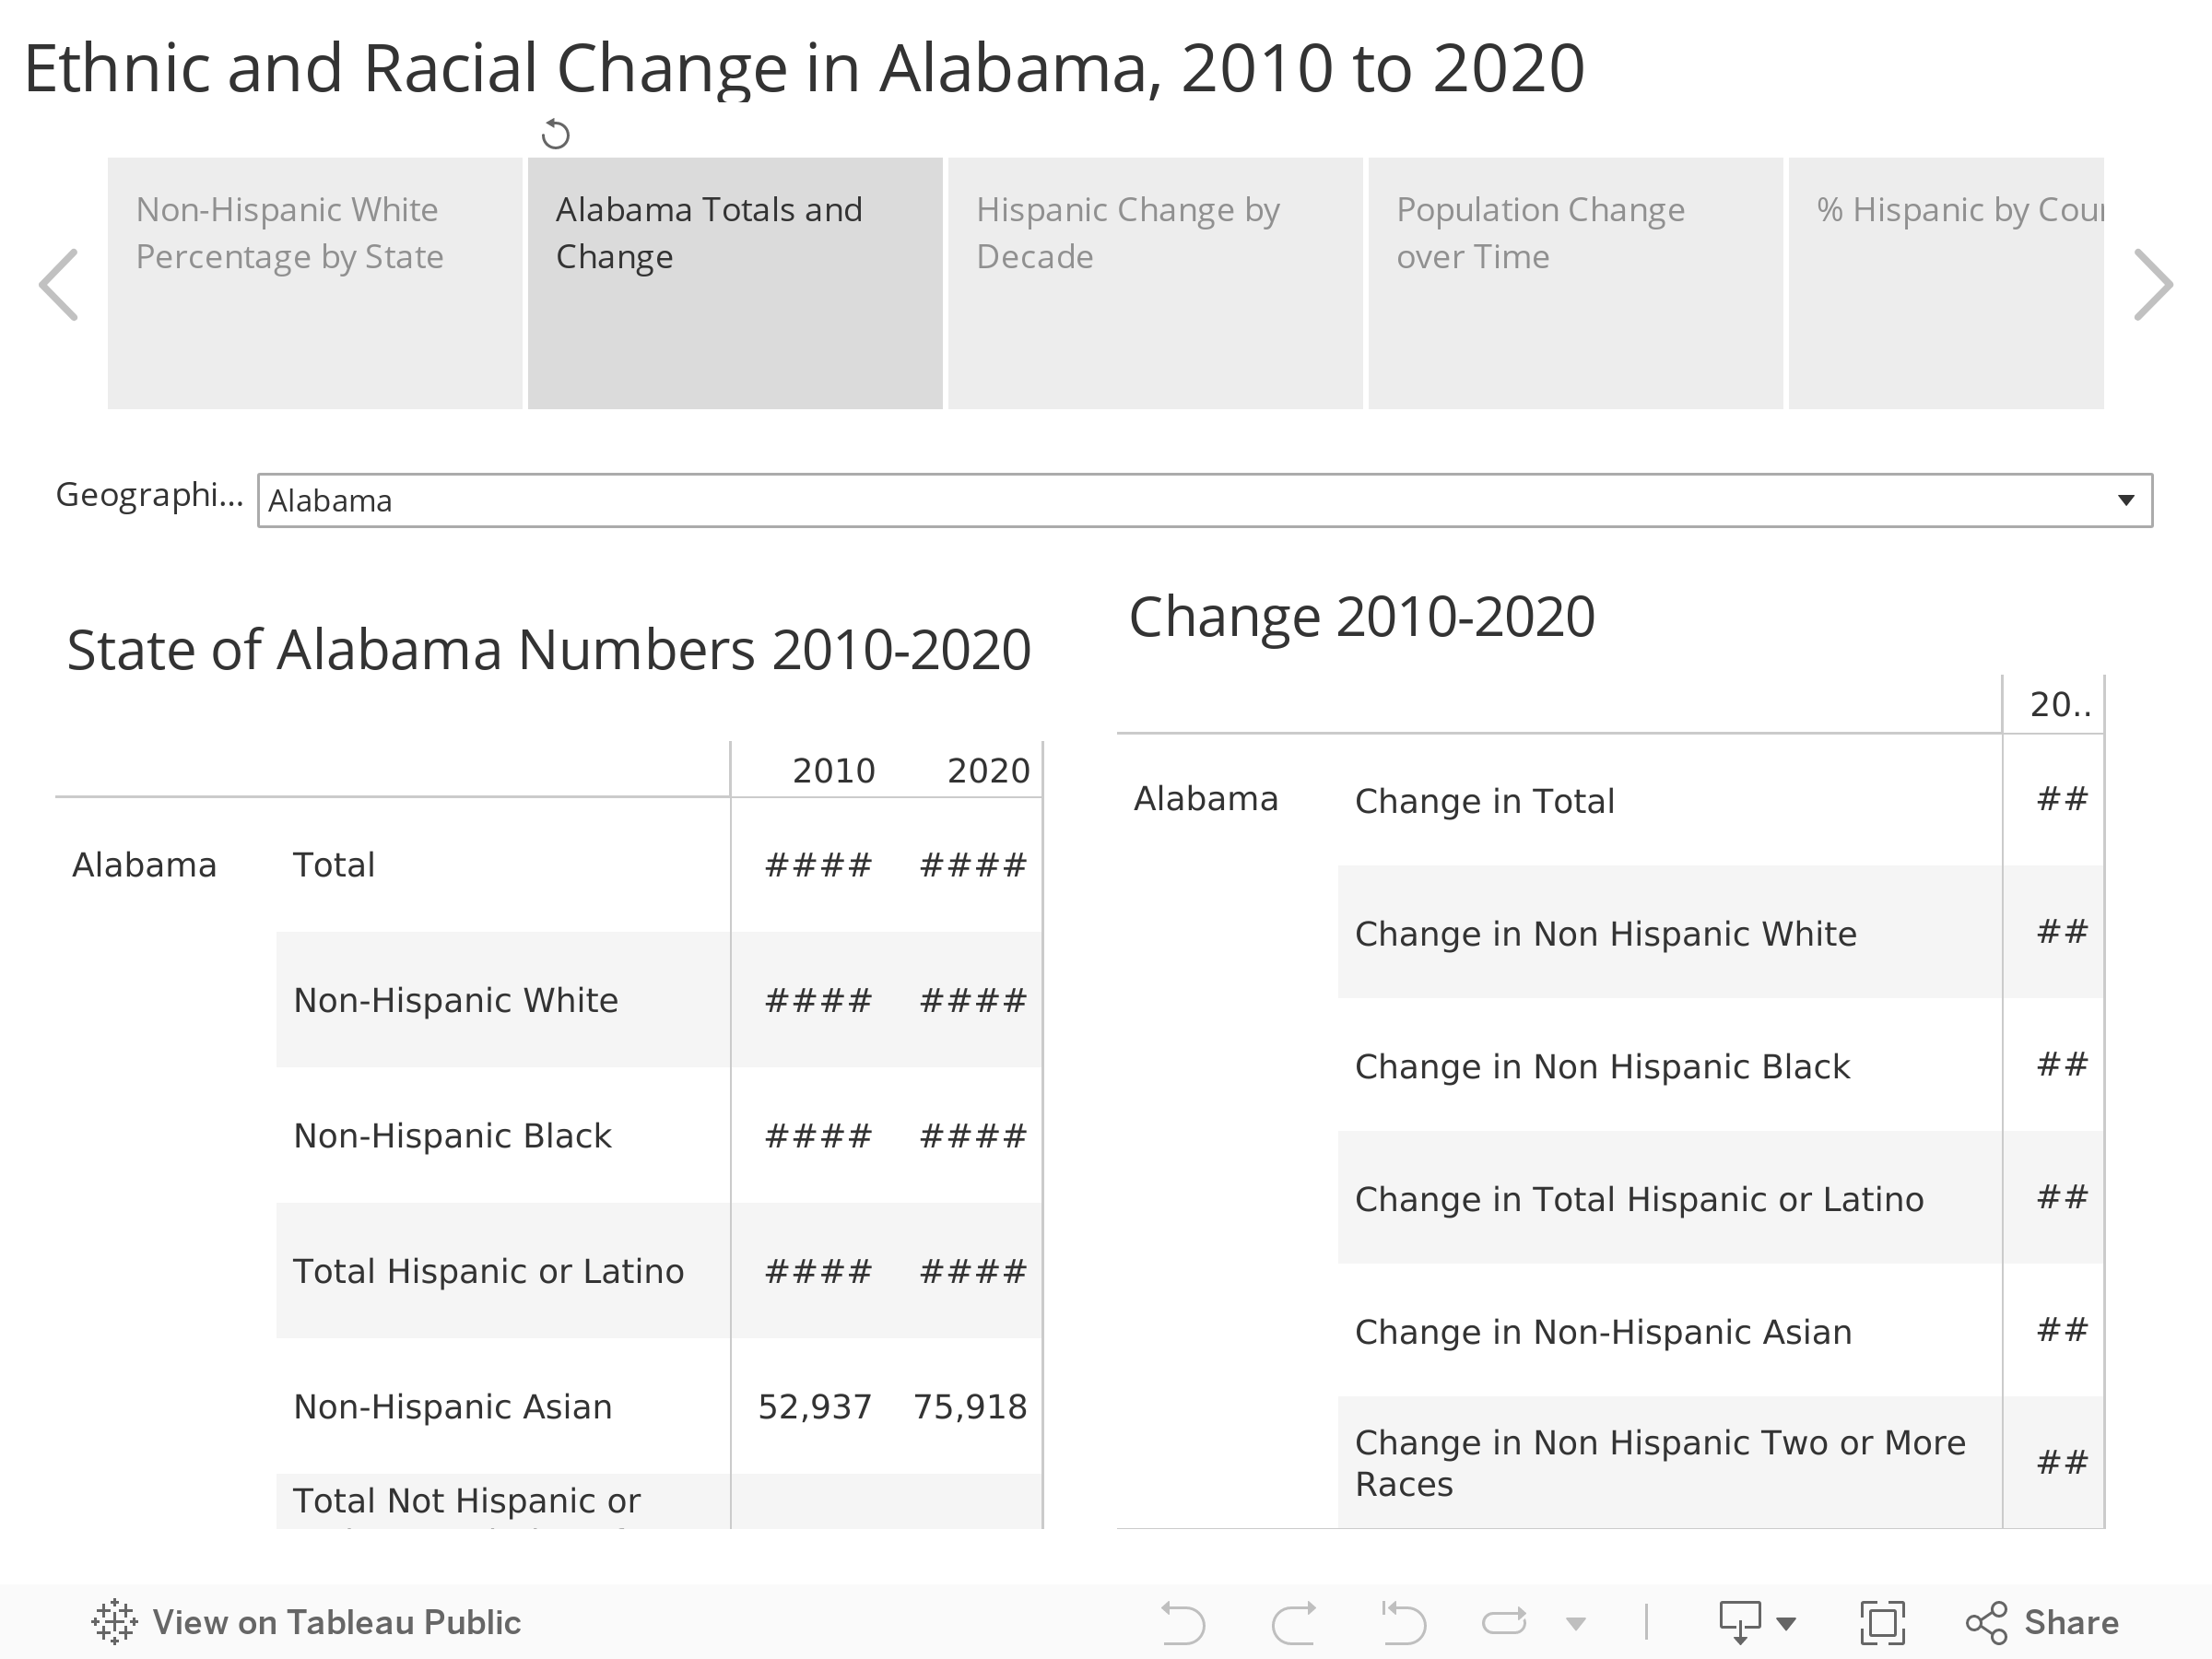
Demographic Change in Alabama, its Counties, and Cities, 2010-2020
Alabama’s population became more diverse over the past decade as the number of non-Hispanic Whites declined and more Alabamians identified as being of a different race, a mixture of races, or of Hispanic descent. In 2010, 67% of Alabama’s population identified as non-Hispanic White; By 2020, that percentage was down to 63%. That’s according to 2020 Census data released earlier this year.
The 2020 Census marked the first decennial census in history that either Alabama or the U.S. recorded a decline in the White population. Demographers expected a decline due to falling birth rates and the aging of the population, including the unusually large and predominately White Baby Boom population. Black, Hispanic, Asian, and American Indian populations all increased. But the biggest change was in the number of people identifying as More than One Race, indicating an erosion in traditional ethnic and racial distinctions.
The Census Bureau cautions that some portion of the decline in the “Non-Hispanic White alone” population is likely due to changes in how people responded to new wording on the race question. The Census Bureau changed the wording and presentation of the race question on the 2020 Census. In 2020, for the first time, the “White” choice was followed by example countries of origin in Europe, the Middle East, and North Africa. Similarly, the Black or African American option listed African and Caribbean nations as example origins. All respondents were asked to elaborate on their origins in a text box below their selection. This change from 2010 appears to have led more individuals to reclassify themselves as not being “White alone” but instead as being of more than one race or origin. Regardless, the Bureau believes the new totals present a more accurate picture of an increasingly diverse nation.
Nationally, the non-Hispanic “White alone” population decreased by 5 million or 2.6% from 2010 to 2020.
In Alabama, that population declined by 33,000, from 3.20 million to 3.17 million. Meanwhile, the number of people identifying as non-Hispanic and of more than one race far exceeded the increase in any other category, 124,173, compared to the 78,445 increase in the Hispanic population, the second fastest growing group. The number of non-Hispanic residents who reported themselves as White in combination with another race rose by 118,249, a 222% increase, from 53,260 to 171,509, from 1.2% of the population to 3.6%. The number of respondents who reported themselves as Black in Combination with another race also rose sharply, up 130% in Alabama, the third highest growth rate in the country in that category, a numerical increase of 38,767 over 2010.
Hispanics now make up 5.3% of the Alabama population, while non-Hispanic Blacks make up 25.6%. Non-Hispanic individuals of more than one race make up 3.7% of the population, now the fourth largest demographic group.
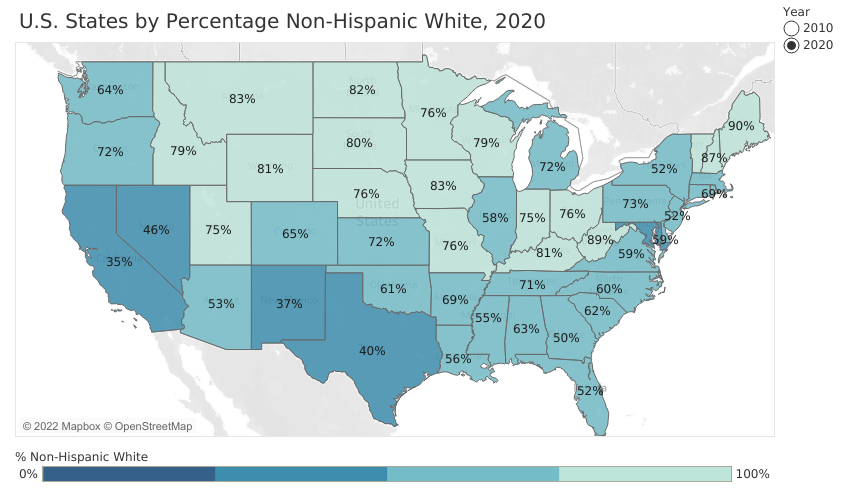
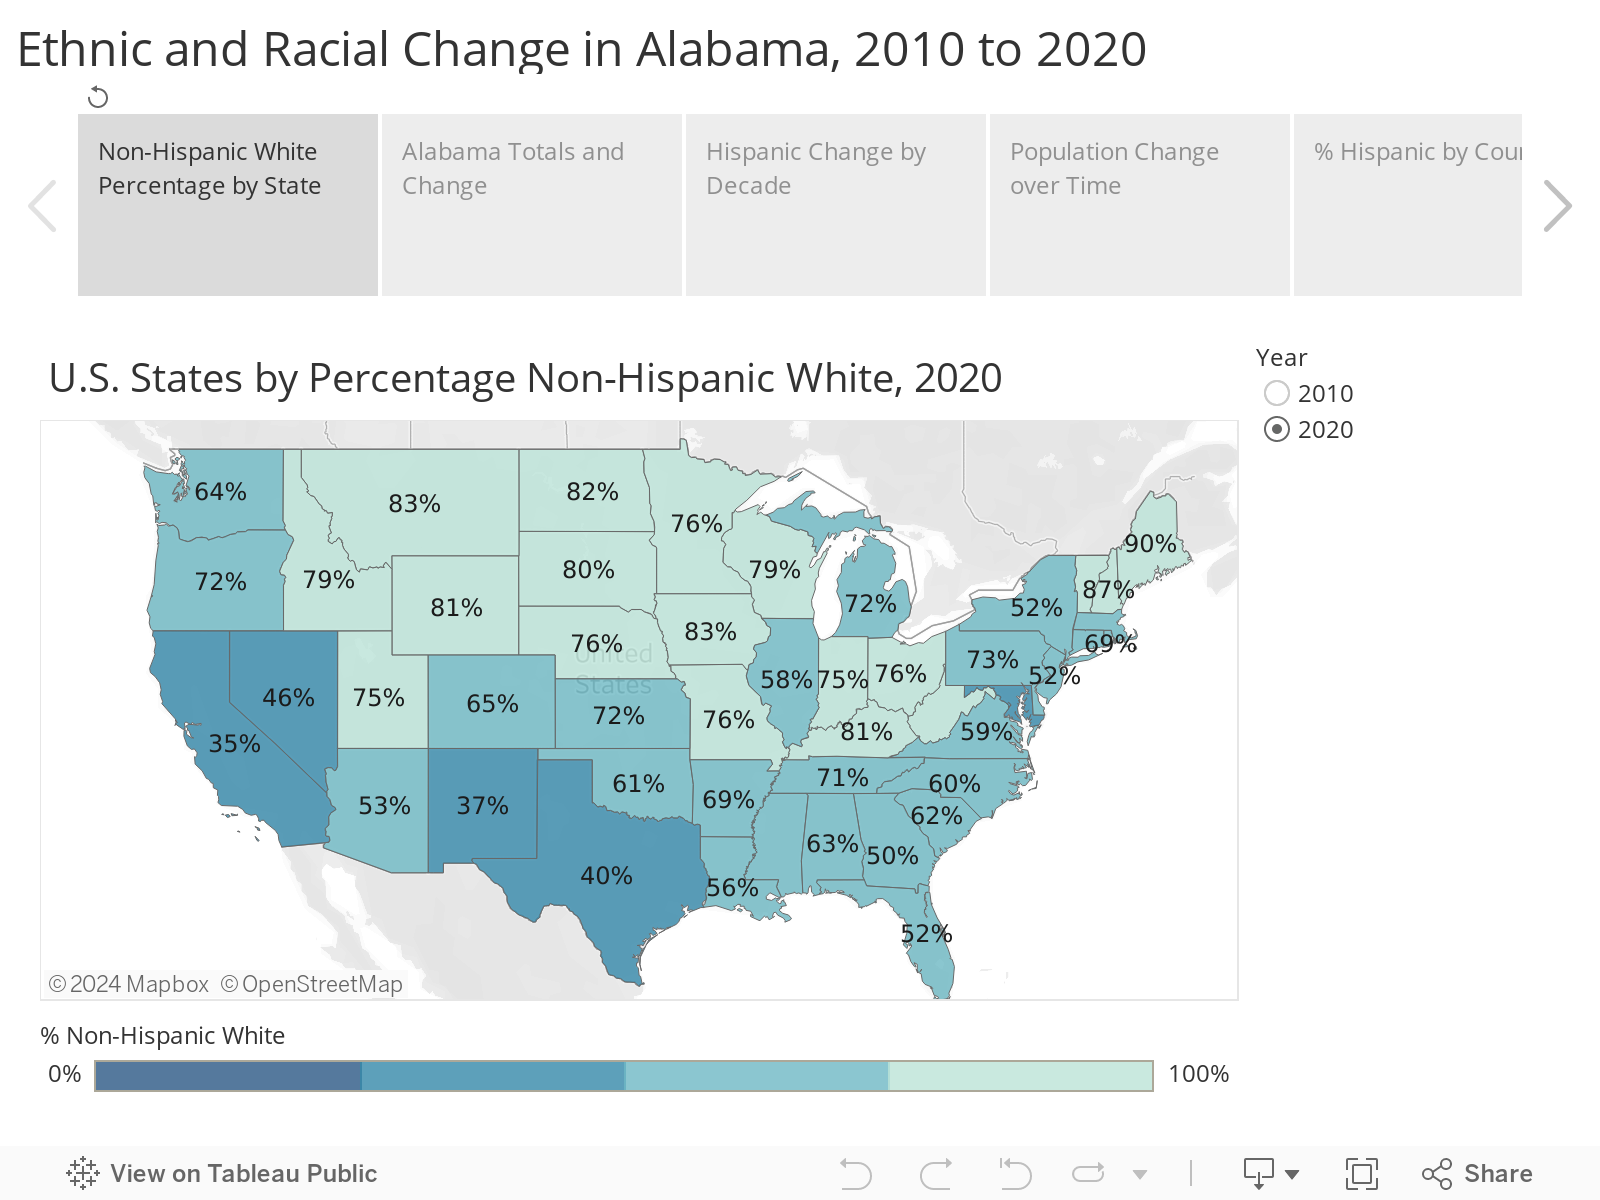
Both in Alabama and across the country, non-Hispanic whites remain by far the largest racial group representing 58% of the population nationally and 63% of the population in Alabama. Alabama’s non-Hispanic white population percentage ranks No. 30 among the states. The state with the highest share of its population identifying as non-Hispanic White was Maine at 90%, followed by West Virginia (89%), Vermont (89%), and New Hampshire (87%).
Hawaii has the lowest percentage of non-Hispanic whites, 22%, followed by California (35%), New Mexico (40%), and Texas (40%). Among its Southeastern neighbors, Georgia’s population in 2020 was 50% non-Hispanic white, while Florida’s was 52%. In all states besides Hawaii, non-Hispanic whites decreased as a percentage of the total state population.
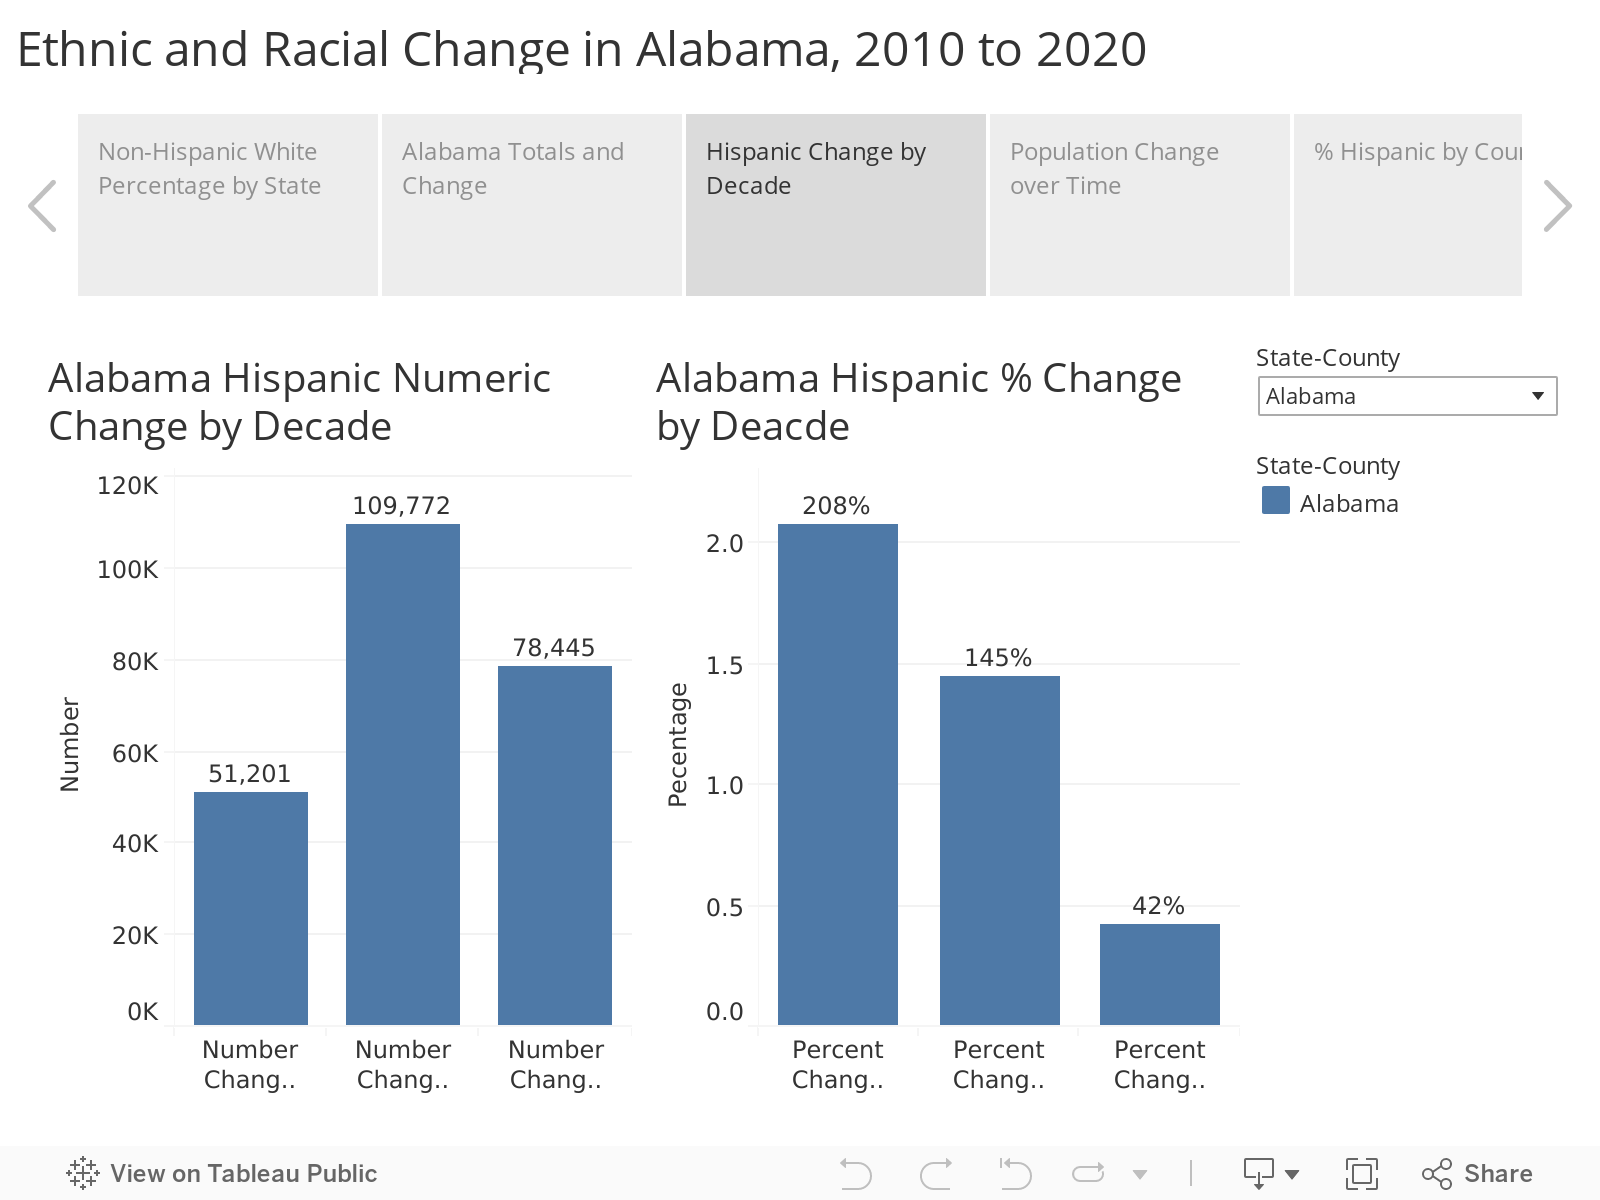
Hispanic or Latino growth rate slows
Unlike the changes to the Census question on race, the question of whether or not the individual is of Hispanic or Latino origin has been consistent for several administrations of the Census. The official definition of “Hispanic or Latino” is a person of Cuban, Mexican, Puerto Rican, South or Central American, or other Spanish culture or origin, regardless of race.
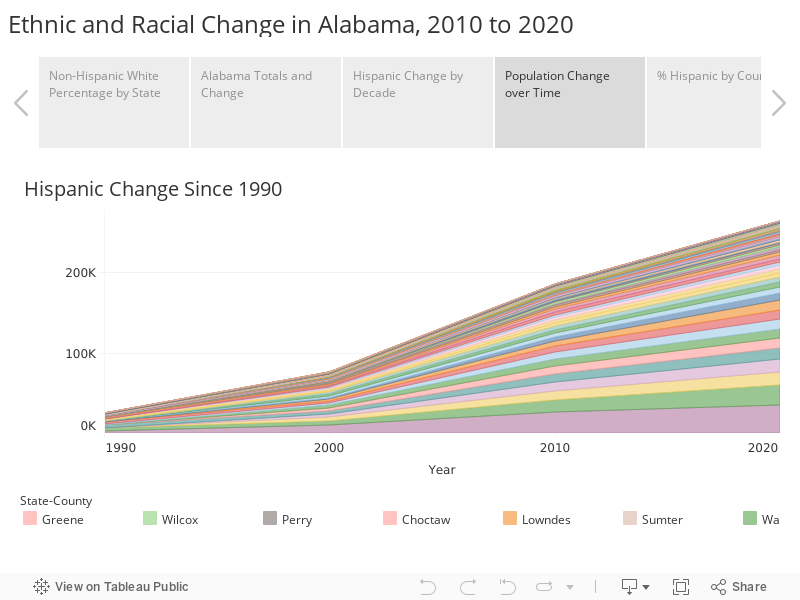
The number of Alabama residents identifying as Hispanic or Latino continued to grow between 2010 and 2020, but at a more modest pace than in previous decades. Alabama’s Hispanic population increased from 78,445 to 264,047, an increase of 42% over the course of the decade. In 2010, Hispanic or Latino individuals made up 3.9% of the Alabama population; by 2020, 5.3%.
The chart below presents decennial Census results from the U.S. Census Bureau supplemented with Census counts from the 2000 and 1990 Census analyzed by the Alabama State Data Center at the University of Alabama’s Center for Business and Economic Research.
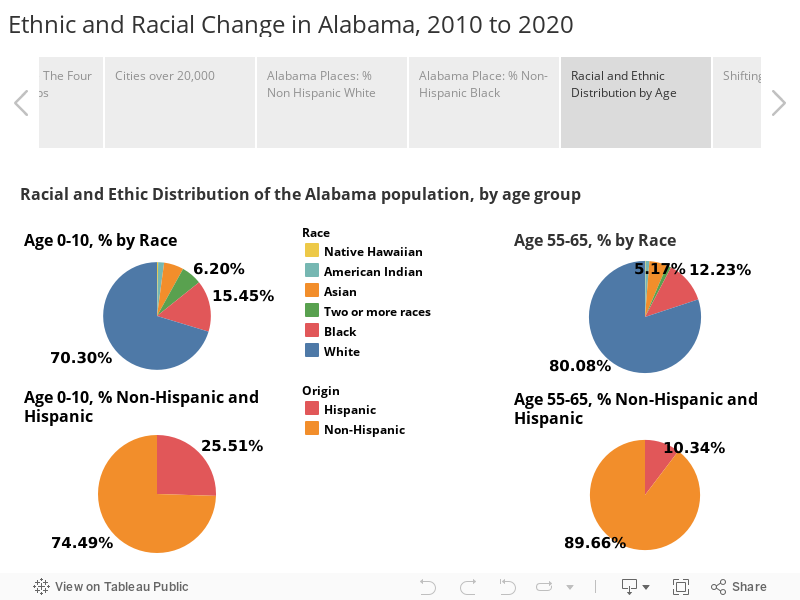
Even without immigration, the Hispanic and Latino population will likely continue to grow more rapidly than the non-Hispanic White population because Hispanics are younger and more likely to be of child-bearing age.
The median age of non-Hispanic Whites in Alabama is 43. The median age among Hispanics is 25. Over 8% of the Alabama population under 18 is Hispanic compared to less than 2% of the population 55 and above.
Also, Hispanic mothers have a higher total fertility rate than other demographic groups. The Total Fertility Rate is the number of births that a hypothetical group of 1,000 women would have over their lifetimes. Reducing that rate to an average per female, Hispanic females average 1.9 children over a lifetime, Blacks, 1.7; for Whites, 1.5.
Demographers calculate the replacement level, the rate of births it would take to replace any given generation, to be 2.1 children per female. Generally, since the 1970s and consistently since 2008, the U.S. birth rate has been below replacement level, meaning that, absent immigration, the population will eventually decrease because not enough children are being born to replace the previous generation.
Hispanic and Latino individuals are widely dispersed across the state, appearing in every county. Much of the Hispanic population growth likely came from natural increase, state residents giving birth, rather than new immigration. For Alabama, the Census Bureau estimated that 57% of all population growth came from natural increase, 32% from international immigration, and 11% from domestic migration.
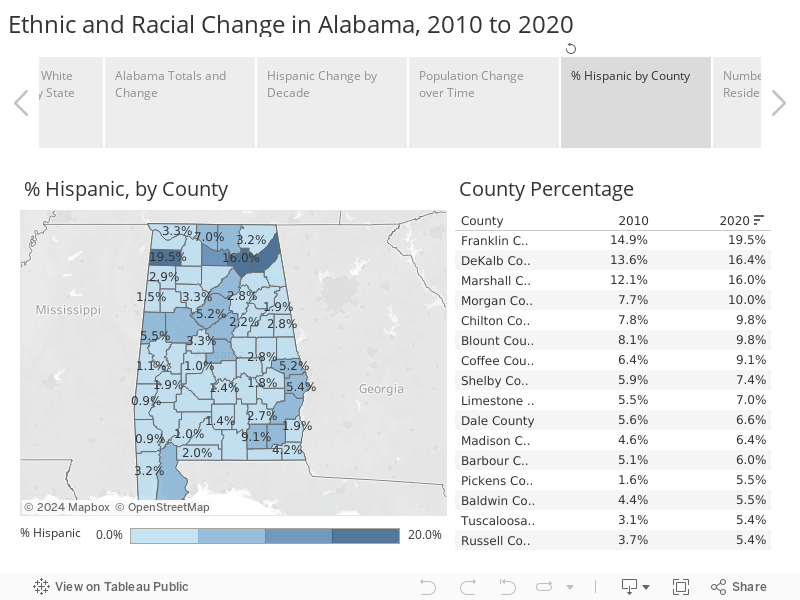
Hispanic Population in Alabama Counties
In Alabama, the counties with the highest percentage of Hispanic residents are in North Alabama, in a band stretching from Franklin County in the west to DeKalb County in the east. Those counties where the Hispanic population is most concentrated are also centers for the poultry industry, which was an initial draw for Hispanics settling in Alabama. Secondary concentrations are evident in Tuscaloosa and Pickens counties and in Southeast Alabama’s Wiregrass region. Those are also coincidental with poultry industry concentrations. Higher percentages of Hispanics can also be found in counties like Shelby, Madison, Baldwin, Lee, and Limestone, where residential and commercial construction jobs are plentiful.
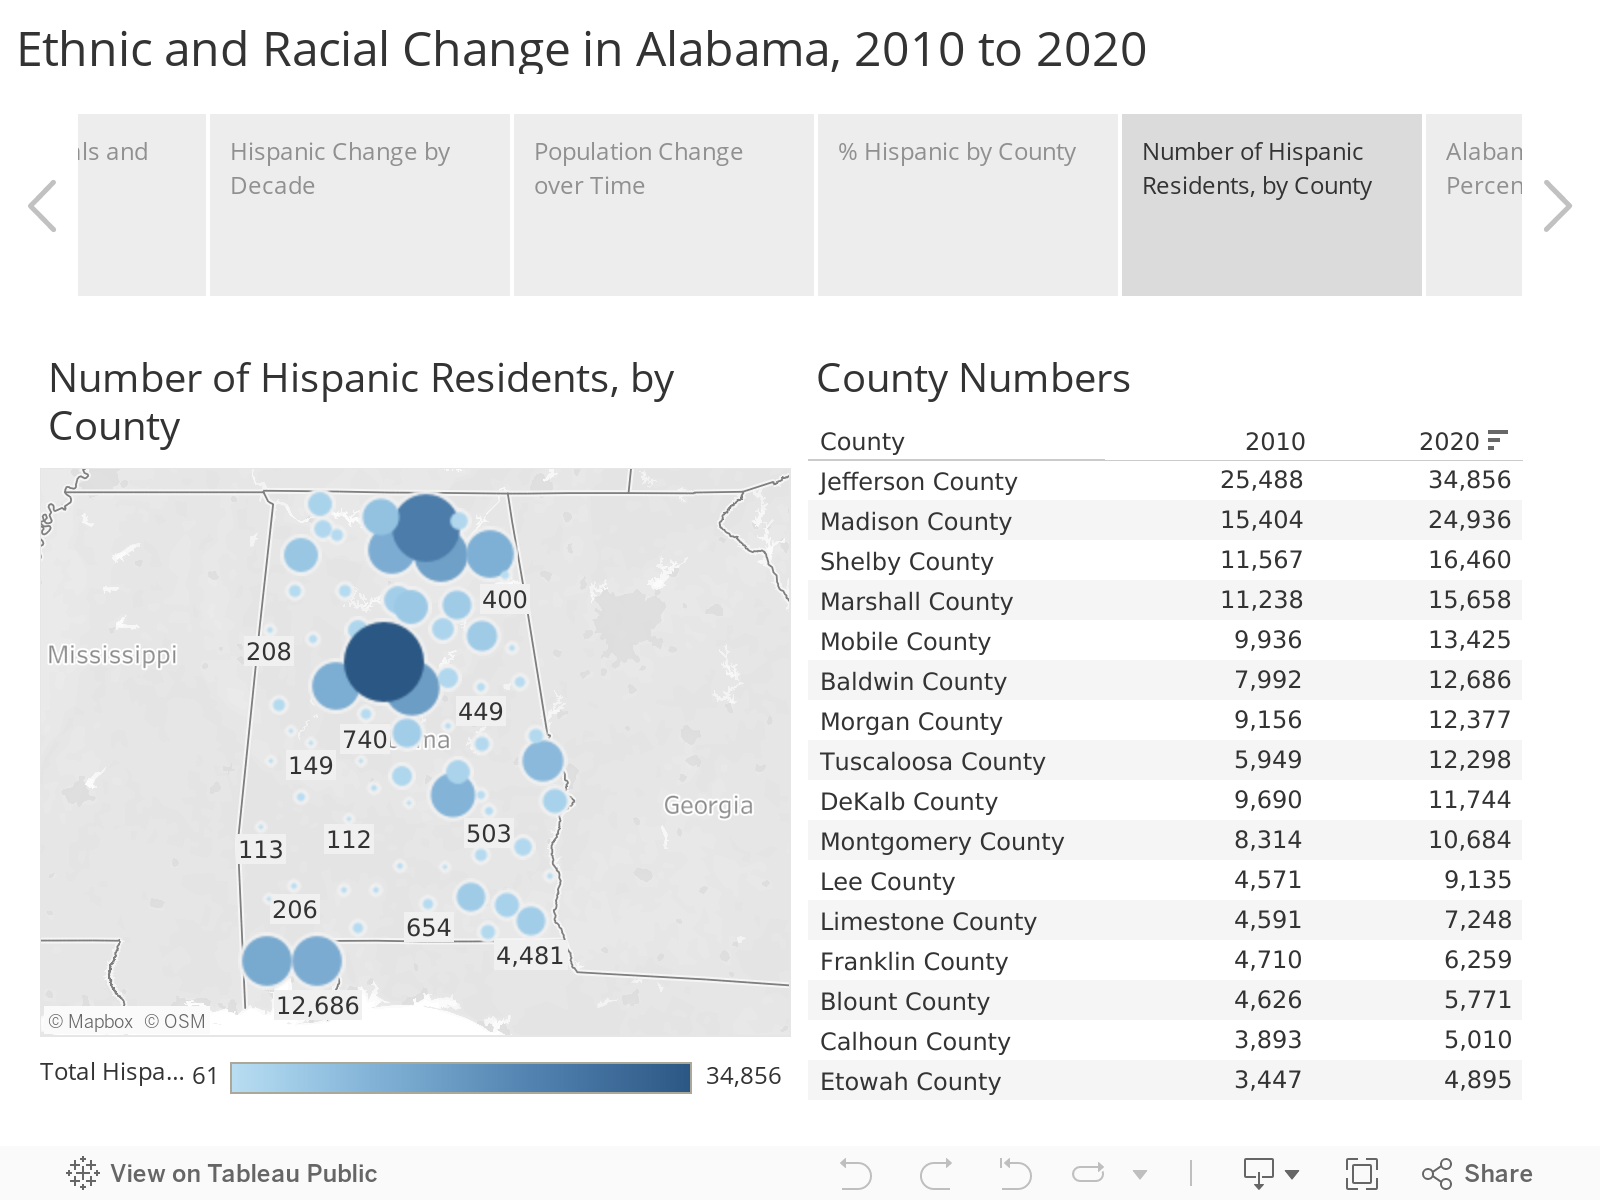
But in terms of numbers, the most Hispanic and Latino residents are found in Alabama’s more populated metro counties. Jefferson County’s Hispanic population is now nearly 35,000, while neighboring Shelby is home to over 16,000. Madison County is second in the state with almost 25,000 Hispanic and Latino residents, complemented by strong Hispanic populations in neighboring Marshall (15,658) and Morgan (12,377) counties. Madison added more Hispanic residents than any other Alabama county over the previous decade.
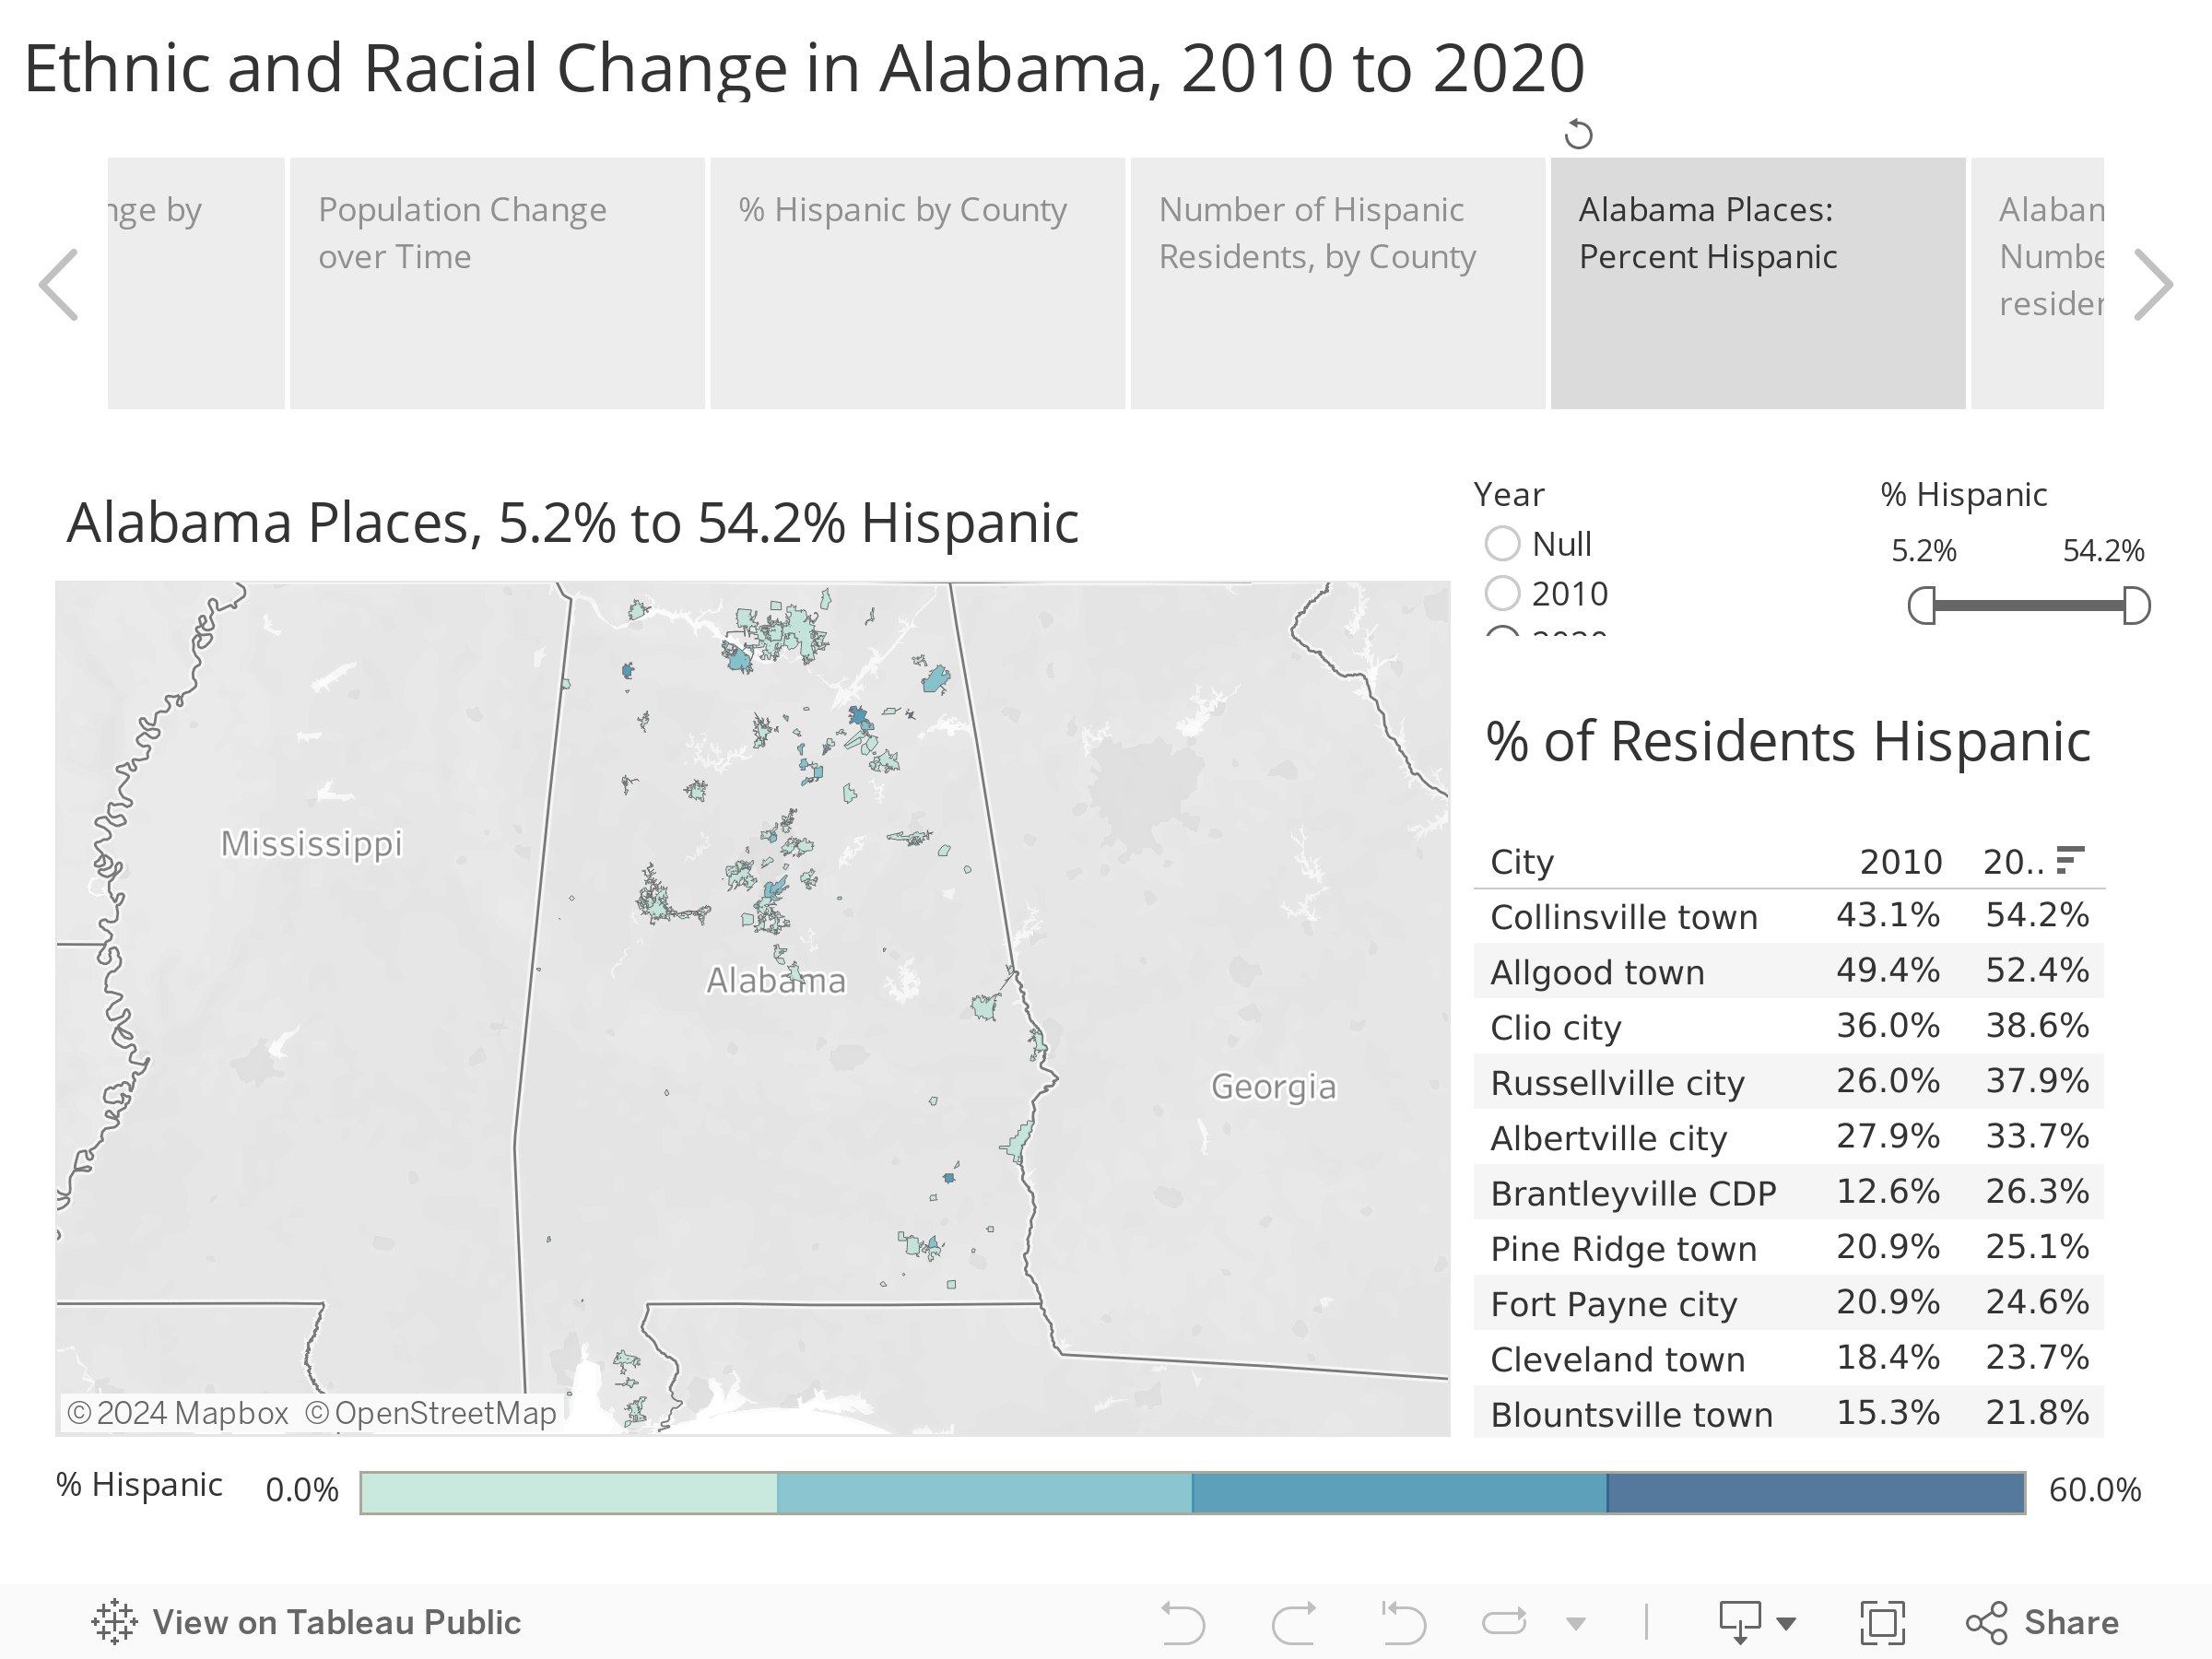
Hispanic Population in Alabama Places
Parallel geographic concentrations of Hispanic individuals can be seen in the population of Alabama cities, towns, and places. Alabama now has two municipalities where a majority of the population is Hispanic: Allgood in Blount County and Collinsville in Dekalb, according to the 2020 Census.
Among cities with a population of 20,000 or more, Albertville (population 22,386) has the highest Hispanic percentage of population, with the 7,545 Hispanics living there constituting 34% of the city’s population.
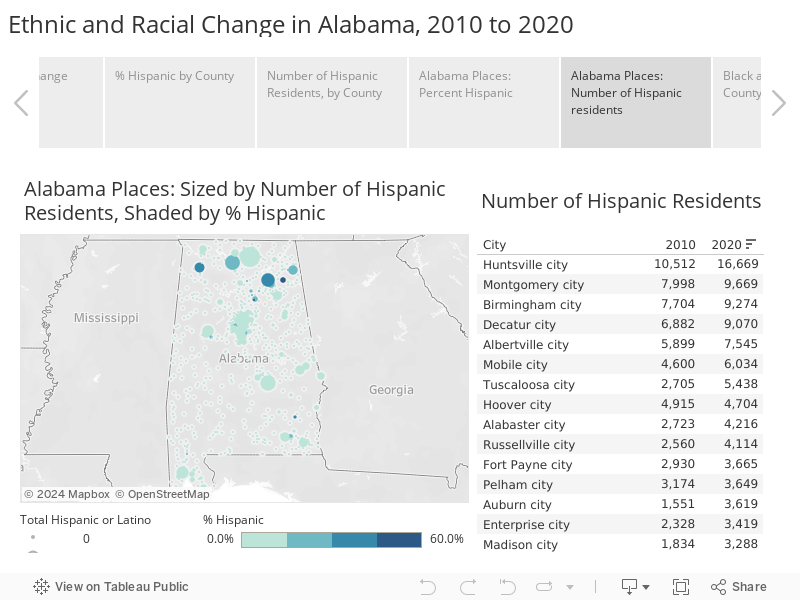
In terms of numbers of Hispanic inhabitants, the larger populations are found in the state’s big cities. Huntsville has more Hispanic residents, 16,669, than any other Alabama city, followed by Montgomery, Birmingham, and Decatur, each with over 9,000 Hispanic residents.
Near Birmingham, Hispanic communities along the Interstate 65 corridor in Hoover, Pelham, and Alabaster total over 10,000. Out of 597 Alabama cities, towns, and places, 450 saw either flat or increases in the Hispanic population. Among Alabama cities above 20,000 in population, only two, Hoover and Homewood, saw a decline in their Hispanic populations over the decade. Homewood was down by 417, Hoover by 211.
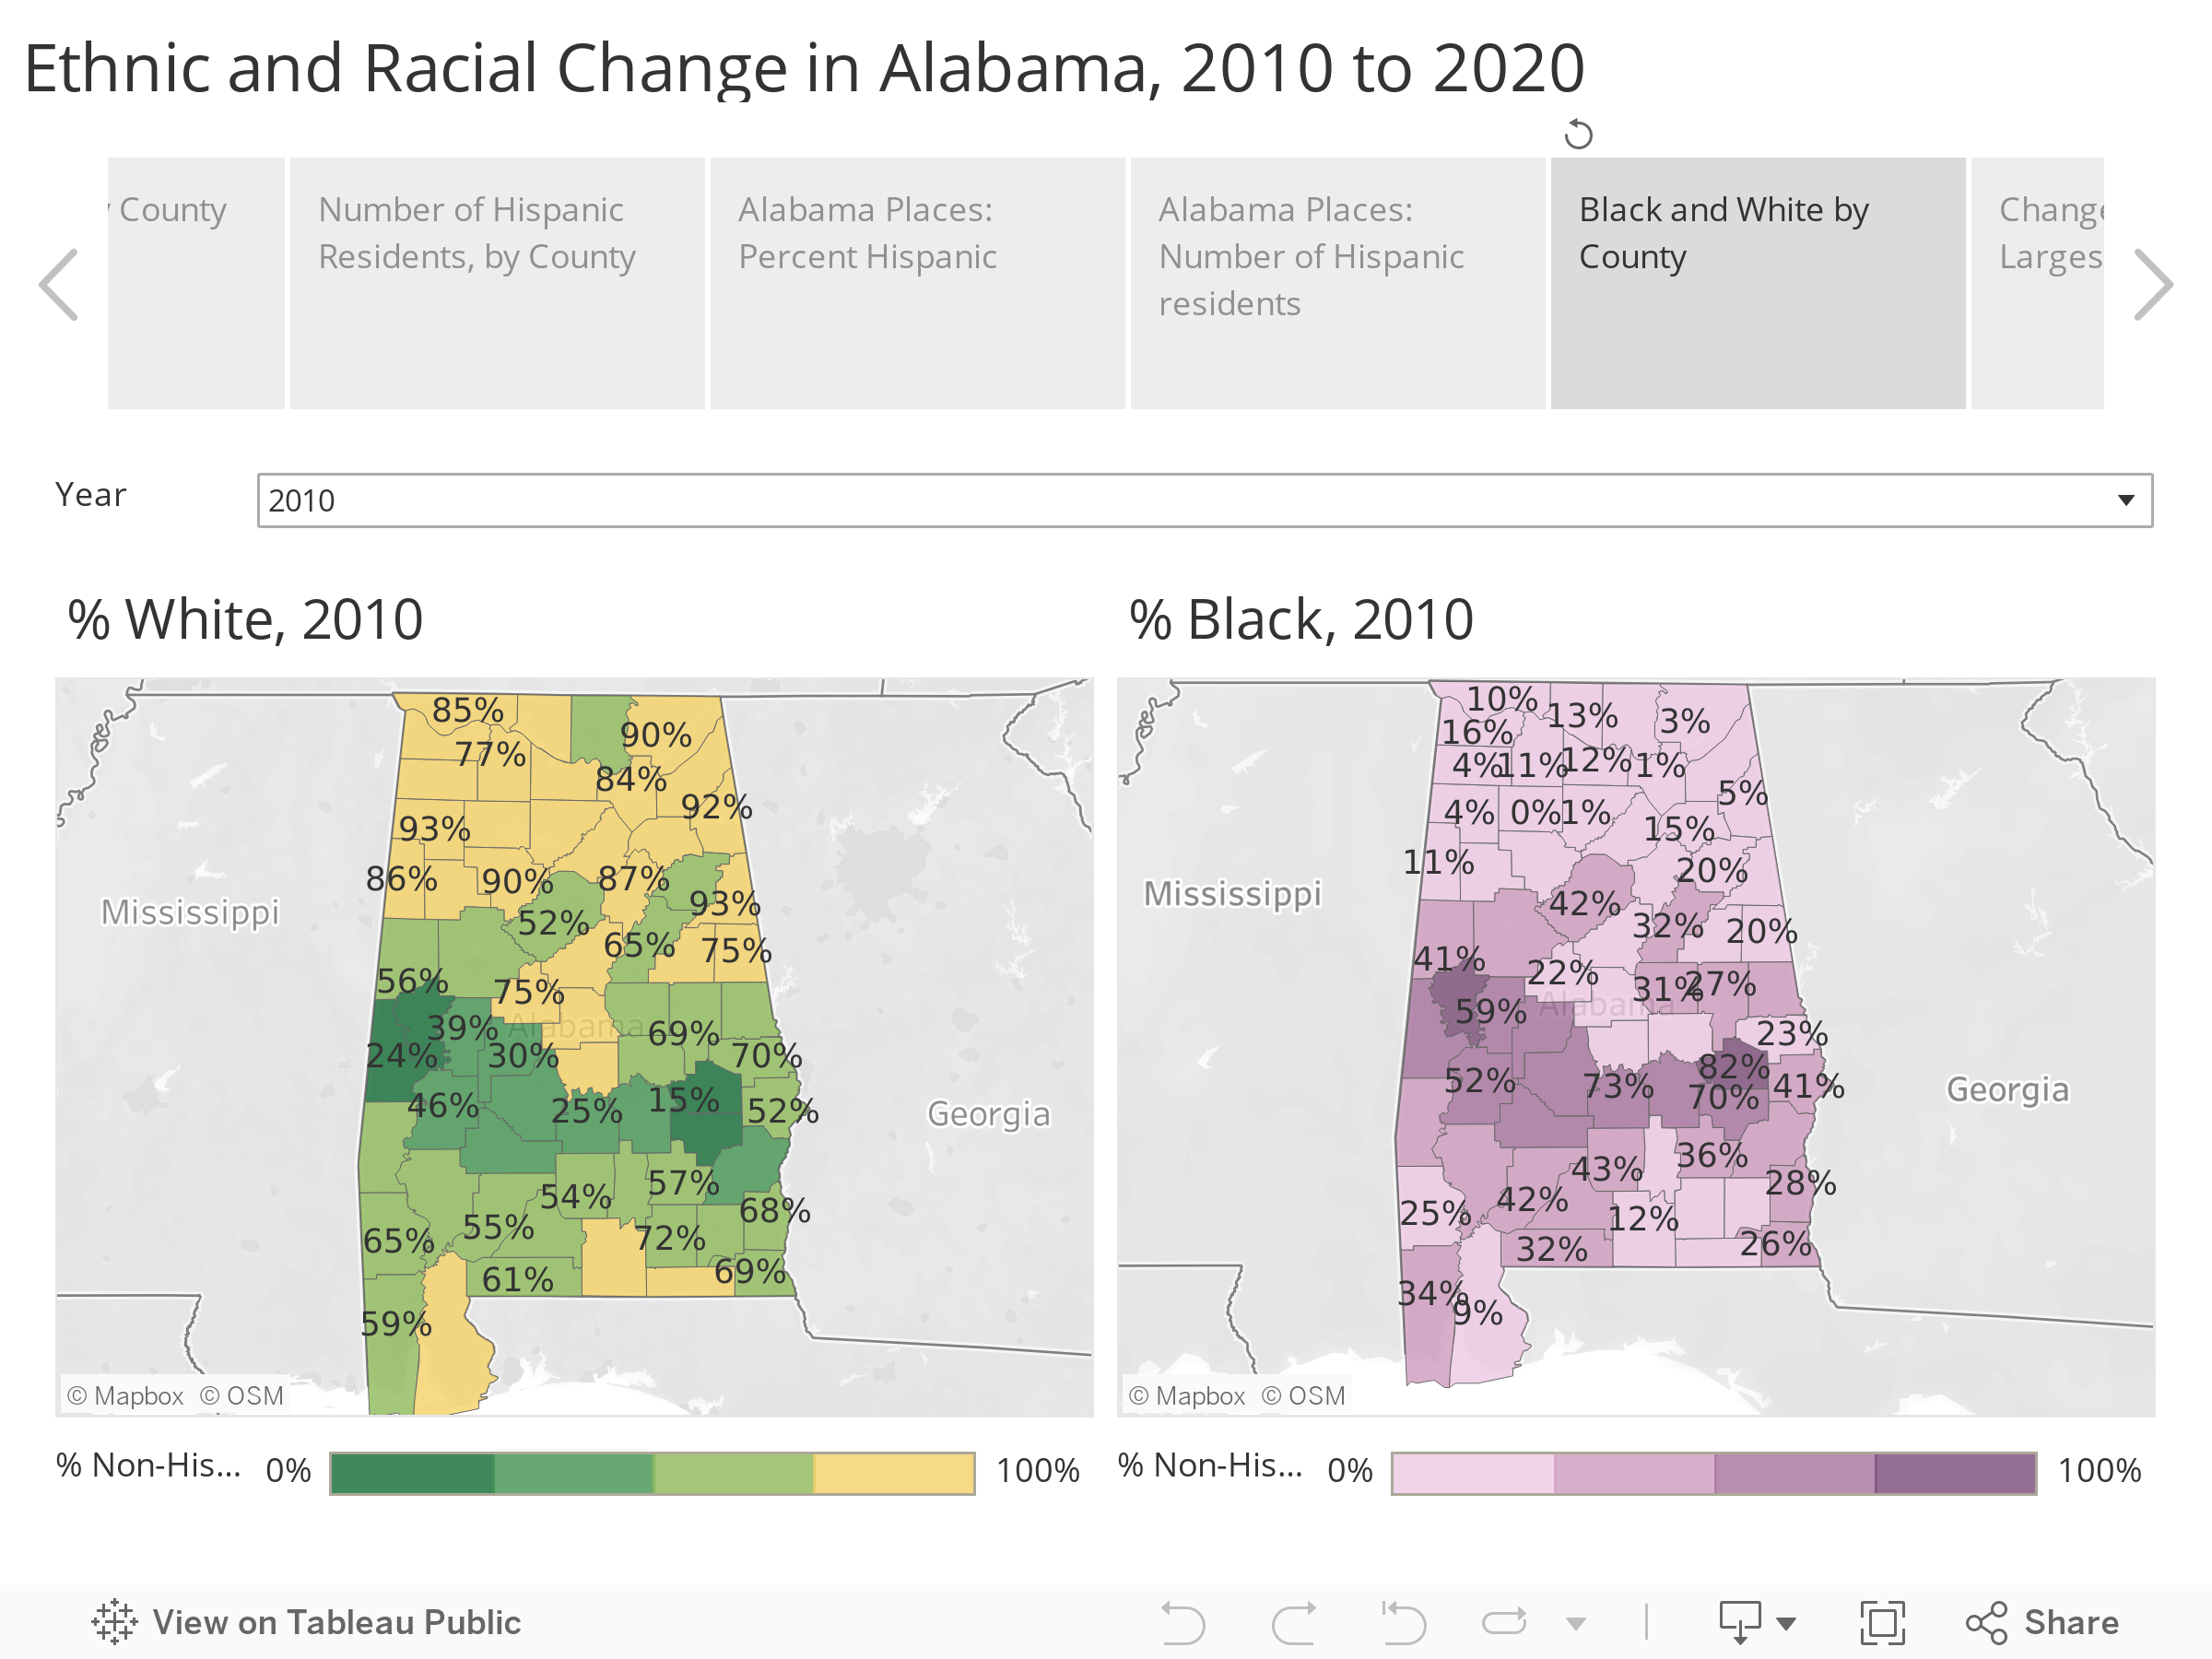
Black and White: Enduring Patterns and Subtle Changes
While the Hispanic, Asian, and multiracial populations are of interest because of their rate of change, the enduring story of Alabama is the population patterns of Black and White, a story stretching back to statehood.
The general pattern remains in Alabama: 11 counties are majority black, the south central Alabama counties of the Black Belt, named for their rich soil, counties that historically had the highest concentration of cotton plantation agriculture and enslaved persons. Those black majorities persisted after emancipation and continue today.
Greene County has the highest percentage of non-Hispanic Black population, over 80%. The most populous majority black county is Montgomery County, with over 229,000 residents, 55% of whom are Black.
Meanwhile, Winston County, in rural northwest Alabama, has the highest percentage of Non-Hispanic White residents at 92%, with Cleburne (91%), Cherokee (90%), Cullman (89%), and Marion (89%) not far behind.
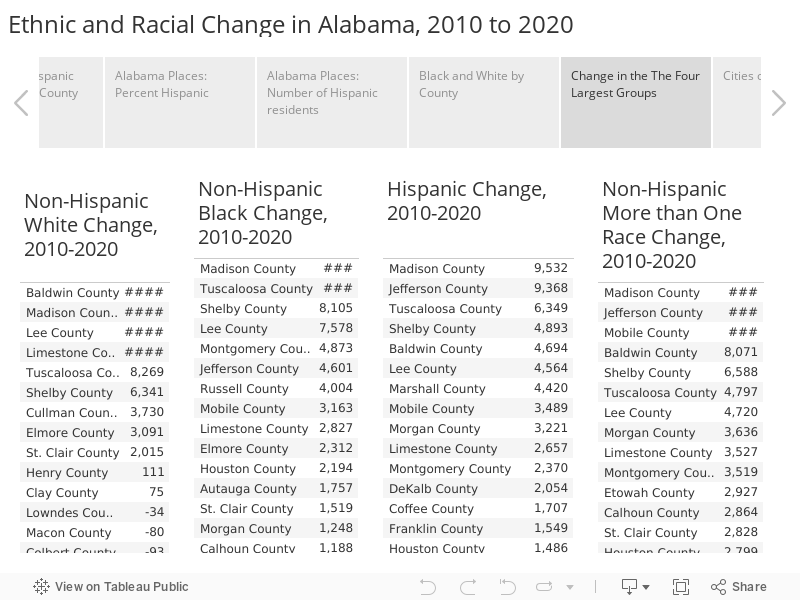
In 11 counties, the Non-Hispanic White population increased. Baldwin County saw the largest increase over the decade, with a gain of 34,000, followed by Madison, Lee, and Limestone. However, those counties all diversified as well. Blacks, Hispanics, and other groups also grew in numbers.
The counties with the most significant decline in the number of residents identifying as Non-Hispanic White were Mobile (-17,201), Jefferson (-15,961), and Montgomery (-14,745). Remember that some of that “decline” in the count may be attributed to individuals reclassifying themselves. However, those population changes in the white population correspond with overall population counts and flows that show continuing movement to suburbs located in adjacent counties.
In each of the central metro counties, the percentage of the population identifying as non-Hispanic White has declined as a share of the population as the Black, Hispanic, and other racial and multiracial subgroups increase. Non-Hispanic Whites represented 52% of Jefferson County’s population in 2010; by 2020, that percentage was 48%. Blacks make up 42% of the Jefferson County population in 2020, roughly the same percentage as in 2010. The Hispanic population grew by over 9,000, increasing from 4% to 5% of the population. The group with the biggest increase in Jefferson County was non-Hispanic More than One Race, up 12,921, constituting 3% of the population.
In Montgomery County, 38.4% of the population was non-Hispanic White in 2010; In 2020, 32%. The Black majority in Montgomery County increased from 55% to 57%. Hispanics increased by 2,370, now representing 2% of Montgomery County’s population, up from 1% in 2010. Asians 3,160, now 4% of the population, while the non-Hispanic More than One Race category increased by 3,519 and in 2020 representing 3% of the population.
In Mobile County, the non-Hispanic White population percentage went from 59% in 2010 to 55% in 2020. The Black population increased by 3,163, or 35% of the county population. The Hispanic community increased by 3,489, raising its share of the population to 3.2%. Like Jefferson County, Mobile County’s biggest growth category was in the non-Hispanic More than one race category, which gained over 10,000, making it the second most populous minority group at 3.7% of the population.
Meanwhile, Madison County’s non-Hispanic White population increased by 16,000, but its Black population grew by 16,052, non-Hispanic More than One Race population grew by 13,027, and its Hispanic population increased by 9,532. Despite the growth in the non-Hispanic White population, its population percentage decreased from 66% of the population in 2010 to 61% in 2020.
Just as whites have sought out new housing opportunities in the suburbs, Blacks make up an increasing percentage of the population in Shelby and St. Clair Counties around Birmingham and are also an increasing percentage of the population in Autauga and Elmore counties outside of Montgomery.
Meanwhile, the Black population is also decreasing in Alabama’s Black Belt,
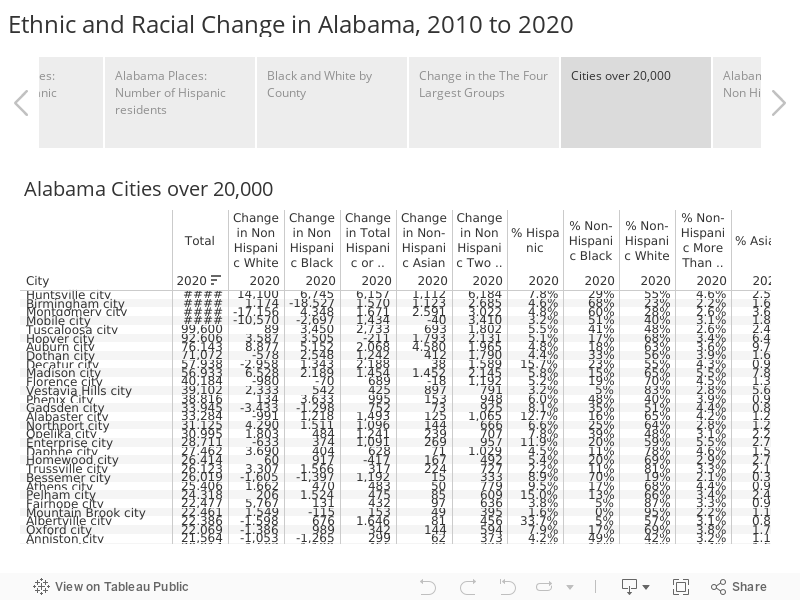
Race in Alabama Cities, Towns, and Places
When looking at cities, some subtle shifts can be seen in the data. Birmingham, which saw decades of White flight, saw an increase in the White population but not enough to offset significant outflows of Blacks. Meanwhile, Montgomery and Mobile, which had maintained more racial balance for longer than Birmingham, saw outflows of White residents and growth in other demographic groups.
In Huntsville, populations increased across all racial and ethnic groups, though that multifaceted growth also produces a diversified population.
Birmingham
Between 2010 and 2020, Birmingham saw a modest gain in its non-Hispanic White population, with an additional 1,000 residents identifying as non-Hispanic White. Meanwhile, Birmingham’s Black population declined by almost 20,000. The city added about 1,500 Hispanic residents, and the number of individuals identifying as non-Hispanic More than One Race was up 2,685. The city saw a net decline of 11,504. Because of the shift, Hispanics and non-Hispanic Whites now represent a slightly higher percentage of Birmingham’s population. In contrast, the Black percentage of the population declined from 73% to 68%., with 23% White, 5% Hispanic, 2% More than one Race, and 2% Asian.
Montgomery
The situation was different in Montgomery. The City of Montgomery’s Black population grew by 4,348, but the White population declined by 17,000. The Hispanic population of Montgomery increased by 1,671. But the most growth came from an increase of 2,591 Asian residents and 3,022 in those reporting More Than One Race. In 2020, Montgomery’s population was 60% Black, up from 56% in 2010. Non-Hispanic Whites dropped from 36% of the population to 28%. Asians climbed to 4% of the population, just ahead of More than One Race at 3%.
Mobile
In the City of Mobile, the White population declined by 10,570, the Black population declined by 2,697, and the Hispanic population increased by 1,434. An additional 3,410 people in Mobile identify as More than one Race compared to 2010. The Black population now represents 51% of Mobile’s population, up from 50% in 2010. The White population represents 40%, down from 44% in 2010. Hispanic and individuals of More than One Race each make up 3% of the population, while Asians represent 2%.
Huntsville
Meanwhile, in Huntsville, each of the four largest groups grew: Hispanics (+6,157) and non-Hispanic Whites (+14,100), Blacks (+6,745), and non-Hispanic More than One Race (+6,184). The non-Hispanic White population decreased in its share of the population from 58% to 55%. The Black population share decreased from 31% to 29%, but the Hispanic share increased from 6% to 8%. Individuals of More than One Race increased to 4.6% of the population, while the Asian share of the population increased slightly to 2.5%.
Growth in the Asian Population
Though the Asian population in Alabama is smaller in comparison to other demographic groups, there has been notable growth in some areas.
The small fishing town of Bayou La Batre in south Mobile County is the Alabama city with the highest percentage of Asians in the population. The Vietnamese community there, established by people fleeing the aftermath of the Vietnam War, represents 20% of the city’s population. However, over the past decade, the number of Asian residents declined by 162.
Meanwhile, the Asian population has grown significantly in several communities and counties along the Interstate 85 corridor, home to Hyundai, Kia, and automotive suppliers with ties to South Korea. Auburn’s population is 10% Asian, after adding 4,580 Asian residents between 2010 and 2020. Montgomery’s Asian population increased 2,591, and neighboring Pike Road added 472 Asian residents.
The Asian population also increased in the Birmingham metro — Hoover (+1,793), Birmingham (+1,123), and Vestavia Hills ($897) — and in Huntsville (1,112) and Madison (+1,452).
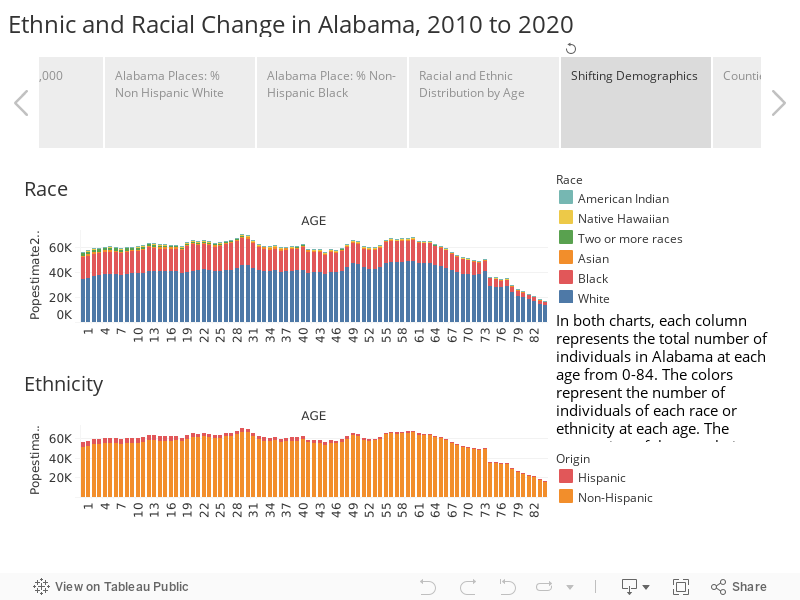
Conclusion
Alabama and the nation continue to diversify due to birth, death, and migration trends. But the statistics from the 2020 Census show that the nation is also changing through marriage and evolving attitudes toward racial identity as customs and generations change. The chart below looks at the Alabama population by age, with the population color-coded first for race and then for ethnicity. Both charts note the increasing racial and ethnic diversity in the younger population.
The shifting demographics challenge Alabama to continue progress toward common goals and increasing equality of opportunity for all.