Grad Rate Dipped, but Career Readiness Climbed for Class 2022

As graduation approaches for the Class of 2023, there’s new data available allowing us to look back on last spring’s graduates.

The Class of 2022 faced particular challenges due to the Covid-19 pandemic, which struck when they were sophomores and persisted through their junior year. In both those years, the number of kids who dropped out was elevated: over 1,000 juniors from the Class of 2022 cohort dropped out, more than double the number of juniors that dropped out in the Class of 2021.

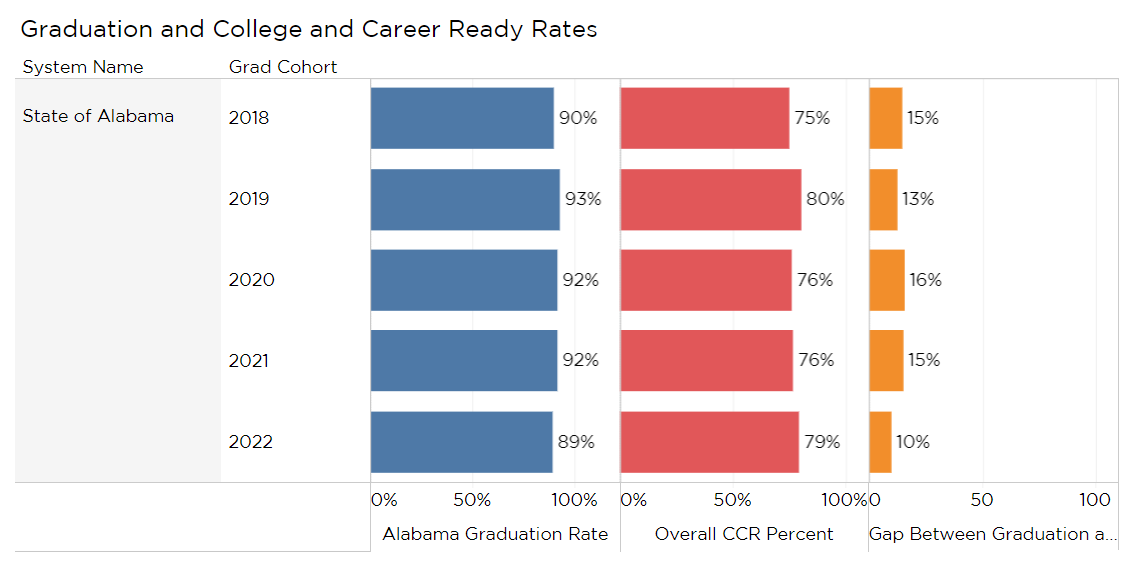
In the end, 89% of seniors graduated, compared to 92% in 2011, but those that persisted were more likely to finish college- and career-ready (CCR).

The Class of 2022 posted a significant jump in the percentage of CCR seniors, thanks to a jump in the percentage of students earning workforce-related credentials and an increase in dual enrollment.

In 2022, 79% of seniors were certified as CCR, up from 76% in 2021. That gain was despite a large drop in the percentage of seniors testing college ready on the ACT. (See PARCA’s previous analysis on the ACT results).

Fig1. Trends in High School Graduation and College and Career Readiness

The Class of 2022 broke a trend of smaller graduating classes, and despite the elevated dropout rate, more students graduated.

State leaders had been calling on schools to close the gap between graduation and career-ready rates.

A lower graduation rate combined with college-and-career readiness means that the gap between graduation and readiness narrowed to 10 percentage points, compared with 15 percentage points the previous year.

Shifts in Readiness

High school students can demonstrate college and career readiness in several different ways. Figure 1. allows you to explore trends on each measure. Diving below the surface on these measures presents a mixed picture of the Class of 2022.

Fig. 2 College and Career Readiness Measures, by Percentage of Seniors Earning

College and career readiness can be demonstrated by one or more of the following: 

  1. Earn an Industry Recognized Credential through Career Technical Education: 39% of students earned an industry-recognized credential through career technical education in 2022, the highest rate for any class. These credentials result from taking work-oriented courses offered at high schools or K-12 career tech centers. Credentials must be tied to a student’s course of study and should be valued in a career field that is in demand in the regional job market. According to State Department of Education data, in 2022, the biggest jump in credentials earned was in certifications in the use of Microsoft software. Big gains were also posted in the number of students earning Certified Guest Professional credentials, a credential associated with the hospitality industry, and in Adult Beef Quality Assurance, an ag-related credential. Also posting gains were credentials associated with healthcare, construction, forestry, and the military’s ROTC programs. Across all grades, the 2021-2022 academic year saw more students earning CTE credentials than ever before: 33,535 compared to the pre-pandemic peak of 31,062 in 2019. While the growth is laudable, attention should continue to be focused on the quality and value of the credentials available.
  2. Earn Credit Through a College: a higher percentage of students earned college credit while in high school in 2022 than ever before: 18%. That’s up from 17% in 2020. These courses, also known as dual enrollment, tend to be taken through a local community college but can also be through a university. The student must successfully complete the course and earn credit to qualify as CCR.
  3. Earn a Qualifying Score through College-level Courses Taught in High Schools: Advanced Placement (AP) courses are taught in a high school but have the rigor and approach of college courses. In 2022, 12% of students qualified as CCR through AP, which is tied for the highest percentage ever. To count as CCR, a student has to score three or higher (out of 5) on the national end-of-course test, a level at which a college might award college credit. The number of students qualifying through success in International Baccalaureate (IB) classes also increased. IB is similar in rigor to AP, though less widely used.
  4. Earn a qualifying score on WorkKeys: 39% of seniors demonstrated college readiness by performing well on ACT’s WorkKeys test. This marked a recovery in the number and percentage of students qualifying by this measure. After dropping from 2019 to 2021, 2022 saw a recovery of 5 percentage points in 2022. WorkKeys is a standardized test designed to measure whether students have the math and communication skills expected in workplaces. WorkKeys is no longer required, and, in many systems, students who have already demonstrated college and career readiness by another means opt out. (More on WorkKeys results below)
  5. Earn a benchmark score in a subject test on the ACT: The percentage of students scoring at or above the college-ready benchmark on the ACT was down by 8 percentage points in 2022, to 37%. This rate has been dipping consistently every year and is now down 14% from 2018.  A student scoring above the benchmark has a 50% chance of earning a B or above and a 75% chance of making a C or above in that course in college. Covid disruptions may have had some bearing on students’ ability to prepare for and take the ACT, which tests readiness for success in college. Alabama’s drop in performance coincides with a national drop that began before Covid but appears to have been exacerbated by the pandemic.
  6. Successfully enlist in the U.S. Military: The same percentage of students gained admission to the military, but that represents an increase of from 519 in 2021 to 590 in 2022. However, that total is less than half of what it was in 2018 when 1,129 seniors entered the military after high school.
Fig. 3 College and Career Ready, by Number of Seniors Earning

The Class of 2022 deviates from recent trends. Over the past few years, fewer students have been progressing through Alabama public schools. From 2018-2021, class sizes were down 7%. During that time, we saw a 6% decrease in graduates and a 5% decrease in career or college-ready students. In 2022 however, we saw a class size increase of 5%, a 2% rise in graduates, and an 8% rise in career or college-ready students. This symbolizes a return to pre-pandemic numbers. However, the new generation of students is known to be smaller. In light of this and the ongoing elevated demand for skilled workers, Alabama must focus on graduating every student with the skills needed to succeed in higher education and/or the workplace.

School and System Results

Last year, one system and twenty-four schools reported a 100% on-time graduation rate. This year, one system, Magic City Acceptance Academy, and only fourteen high schools reported a 100% on-time graduation rate. Fourteen high schools reported both 100% graduation and 100% CCR rate. In some schools, a higher percentage of seniors demonstrated college and career readiness than graduated.

Fig. 4 CCR and Graduation Rates by System, 2022

On the other hand, fifteen schools had graduation rates below 75%. Nineteen high schools had CCR rates below 50%. Only nine school systems had a gap greater than 25% between their graduation rate and the college and career readiness rate. In those systems, more than a quarter of students receiving diplomas hadn’t demonstrated their readiness for college or work, despite having met Alabama’s requirements for obtaining a high school diploma.

In the visualizations below, school systems and schools can be sorted by either graduation rate or college and career readiness rate. The solid-colored horizontal bar represents the graduation rate; the short vertical bar represents the CCR rate. Through the tabs above the visualization, other data is accessible, including a graph of the gap between the graduation and CCR rate by system.

The same set of sortable data is available by school. In order to protect student privacy, results for small subpopulations of students are not presented.

Fig. 5 CCR and Graduation Rates by School, 2022

Gaps Between Subgroups

Historically, there have been gaps in the high school graduation rate between students of different races. In 2022, the gaps in graduation got slightly bigger, and the gap in overall CCR was slightly reduced. Some trends seen in past years are continued or even exaggerated. CCR rates for economically disadvantaged students are well behind those of non-economically disadvantaged students. Examining the subcomponents of CCR, the gap is widest on the ACT despite everyone achieving lower numbers from years past.

Only 18% of Blacks and 22% of Hispanics benchmarked in a subject on the ACT, compared to 47% of whites. Asians are much further ahead, with 68%. By contrast, there is almost no racial gap in college and career readiness rates in career technical education: 38% of Black students earned an industry-recognized credential through CTE compared to 40% of whites and 40% of Hispanics.

Fig. 6 CCR and Graduation Rates by Subgroup, 2022

WorkKeys

The number of high school seniors taking ACT’s WorkKeys Assessment increased by almost 4,000 in 2022, a major reversal in a downward trend in the use of the test.

Along with higher participation, a higher percentage (60%) and a greater number of students (2,833) qualified as college and career ready as a result of their scores.

Fig. 7 WorkKeys Results, Statewide Trends

WorkKeys is given to seniors and is designed to measure practical math, reading, and graphical literacy skills as they are employed in the workplace. That’s different than the ACT, which tests for knowledge and skills needed in a college classroom.

WorkKeys was given to all seniors through 2019, but the State Department of Education stopped mandating the test in 2019. While some systems still test all seniors, some systems make the test an option for students who haven’t demonstrated college and career readiness by another measure.  

Some businesses, particularly industrial employers, build WorkKeys into their hiring practices. They have determined what level of proficiency, as measured by WorkKeys, is needed in particular jobs. Depending on their test performance, students earn a platinum, gold, silver, or bronze National Career Readiness Certificate. A student scoring Silver or above is considered college and career ready.

Jefferson, Mobile, Montgomery, Limestone, and Lauderdale County systems, as well as city systems in Huntsville, Birmingham, Florence, and Madison recorded large increases in the number of students taking WorkKeys and successfully earning credentials.

Fig. 8. Number of Students Workforce Ready 2022 and Change from 2021

The visualizations that follow present WorkKeys results statewide and in systems where more than 90% of seniors took the test. The percentage of students scoring workforce ready are those that score Silver or above.

Fig. 9. Percentage Workforce Ready by System, 2022

The visualization below presents the results in a more detailed fashion. Each color represents the percentage of tested students scoring at each level: platinum, gold, silver, bronze, and no certificate earned.
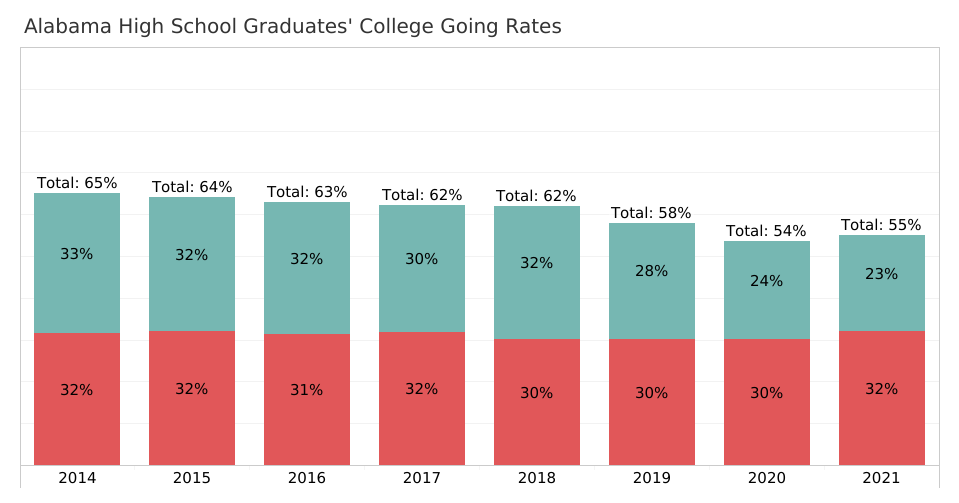
Fig. 10. WorkKeys Results, by Level of Certification, 2022

Alabama’s College-Going Rate Begins Recovery; Still Below Pre-Pandemic Rates

Alabama’s 2021 public high school graduates entered higher education at a slightly higher rate than the Class of 2020, according to new data from the Alabama Commission on Higher Education. However, with only 55% of graduates entering higher education the year after graduation, the 2021 rate was still much lower than in the years before the pandemic.

Remarkably, though, the percentage of high school graduates enrolling at 4-year colleges is tied with its highest rate on record, with 32% of Alabama high school graduates enrolling at 4-year schools. Even more notable is that the 4-year college-going rate for Black and White high school graduates was equal among the Class of 2021: 33% of Black high school graduates and 33% of White high school graduates in Alabama enrolled in a 4-year college the year after graduation. Historically, there has been a gap between the rate of enrollment of Black and White students in college.

Printable PDF version available here.

The new data comes from the Alabama Commission on Higher Education (ACHE), the state’s higher education coordinating body. ACHE annually queries the National Student Clearinghouse of Data to check which of Alabama’s high school graduates enrolled in college, either two-year or four-year, anywhere in the country in the year following their high school graduation. Maps, college-going destinations, and rates are available for high schools and public school systems by exploring the tabs in the visualization.

The figures for the Class of 2021 show a continuing decline in the number of recent high school graduates enrolling in two-year colleges. Only 11,389 or 23% of graduates enrolled at a community college compared to the more than 15,000 typically normally enrolled in community colleges in the years prior to 2018.

The number and percentage of students enrolling at 4-year colleges increased to 15,856 or 32% of recent high school graduates. Prior to 2019, the number and percentage of students who enrolled in four-year colleges and two-year schools were about equal.

Trends

College-going rates have been affected by multiple factors over the past decade. Between 2010 and 2020, as Alabama’s high school graduation rate climbed from 72% to over 90%, the percentage of those high school graduates going immediately into college declined. Some of those additional graduates likely lacked the academic preparation to go straight into college.

Two-Year Colleges

Also, in the current economy, demand for workers is at historic highs. Low unemployment and a strong economy typically drive down two-year college enrollment. And statistics support the idea that more high school graduates are entering the workforce rather than pursuing education. According to U.S. Census Bureau surveys, 32.6% of individuals between the age of 16-19 were in the labor force in Alabama in 2014. By 2021, 39% of 16 to 19-year-olds were in the labor force, according to Census.

The Covid-19 pandemic also disrupted college enrollment, particularly at two-year colleges. For graduates of the Class of 2020, two-year enrollment fell under 12,000, marking the lowest total since 2014, the earliest year in the dataset. And for the Class of 2021, the numbers were lower still, 11,389.

While those recent high graduates may be delaying entry to community college, other enrollees have begun to return to two-year colleges. At the height of the pandemic, overall Alabama community college enrollment dropped by 10,000, from approximately 80,000 to 70,000. Recovery began in 2021, and preliminary overall fall enrollment was above 75,000. Some students who didn’t immediately enter may now be returning to pursue a degree.

A final factor appears to have some bearing on the equation. An increasing number of high school students are also enrolled at community colleges, which is known as dual enrollment. In 2018, only 15,372 students took dual enrollment courses. By the 2021-2022 school year, 23,483 students were dually enrolled. Students taking dual enrollment classes can graduate high school with college credit, with an industry-recognized credential, or even with an associate’s degree. That will increase the chances the student will enroll at a four-year college after graduation or flow into the workforce. Those dual enrollment students aren’t captured in the college-going rate data which tracks high school graduates in the year after their high school graduation.

4-Year Colleges

Meanwhile, recovery was more rapid at four-year schools, with 15,856 graduates of the Alabama public high school Class of 2021 enrolling at 4-year colleges. That’s more 4-year enrollees than any year in the dataset, and it comes in a year when there were fewer high school graduates.

In terms of destination, the Class of 2021 sent more students to Alabama 4-year colleges but also increased the number of students going to out-of-state public and private schools. Enrollment at Alabama private colleges was slightly lower for the Class of 2021.

Interesting patterns emerge when college-going statistics are broken down by race. White public high school graduates are more likely to enroll in higher education than Black and Hispanic/Latino graduates: 58% of whites compared to 51% of blacks and 39% of Hispanics.

As mentioned above, White and Black high school graduates are enrolling in equal proportions at 4-year schools. But there has been a significant shift at 2-year colleges. In 2019, 25% of Black high school graduates enrolled at a 2-year school in the year after graduation. In 2021 only 18 percent did.

And among all groups, there has been an uptick in the percentage of recent high school graduates who did not enroll in college the year after graduating. According to the statistics cited above, these individuals are likely finding employment. It’s also possible that some of these high school graduates earned certificates that will allow them entry into a career with plenty of upward mobility. However, state policy should ensure these individuals have ready access to return to the education and training system if and when they need more advanced skills to pursue a more promising career path.


Despite Headwinds, Alabama Gains in 4th Grade Reading and Math

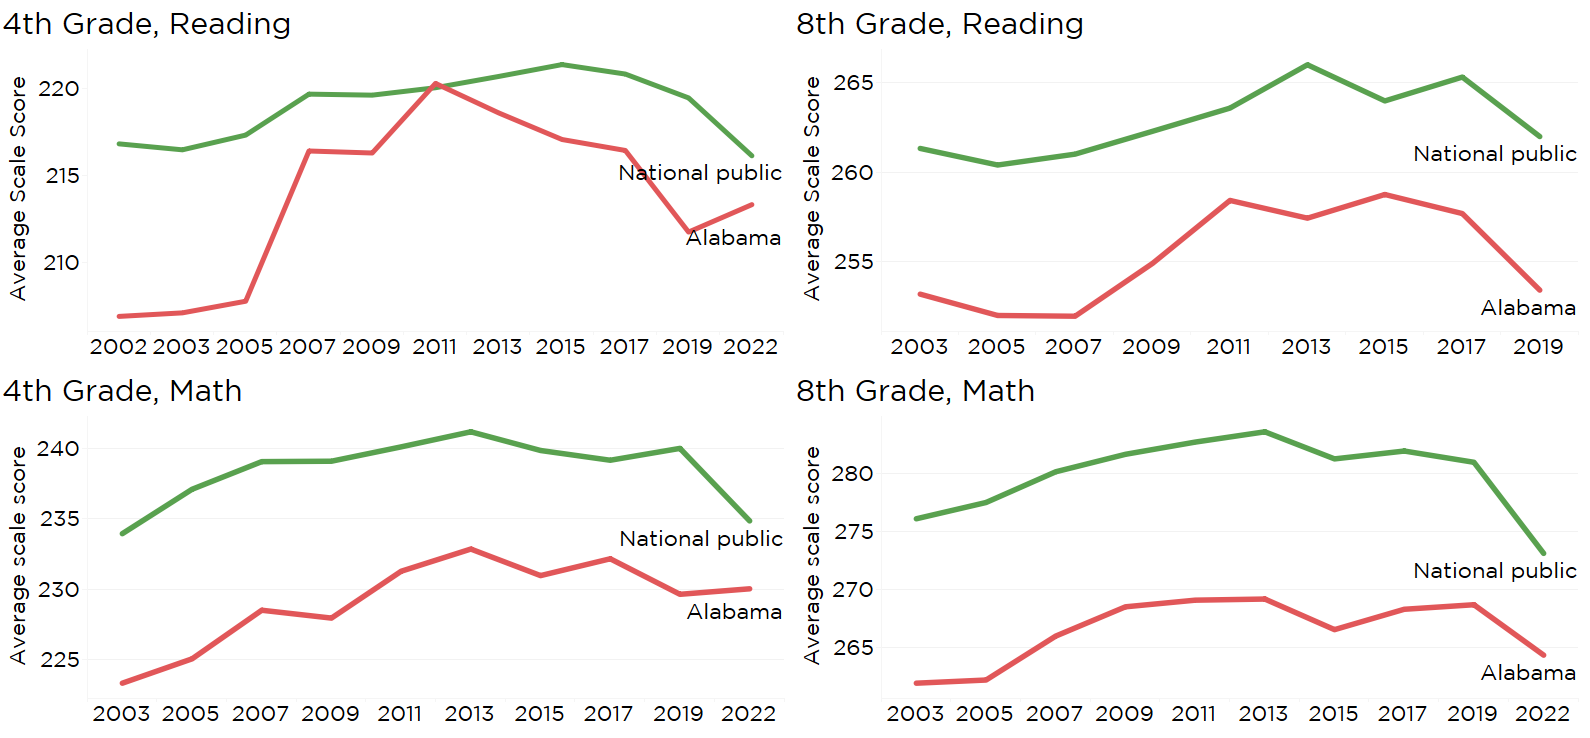
Alabama 4th-grade students performed better in both reading and math between 2019 and 2022, leading to improved national rankings for Alabama on The Nation’s Report Card, the National Assessment of Educational Progress (NAEP). That progress came despite the pandemic, which took a heavy toll on academic performance nationwide. Nationally, NAEP scale scores recorded their worst drops ever.

Alabama was the only state where 4th graders improved in math performance. It was one of only five states to see improvement in Grade 4 reading. Only Louisiana had a higher gain in 4th-grade reading.

To be clear, Alabama’s average scale score gain in both reading and math was not large enough to be considered statistically significant, but, when compared to sizeable scale score declines in many other states, the shift was notable. Alabama’s 8th-grade scale scores were down in reading and math, though, in the case of math, because Alabama lost less ground than other states its national rank improved.

Figure 1. NAEP Performance over time, Alabama vs. U.S.

NAEP results are derived from standardized tests given to a representative sample of students in each state. The most recent test was administered in the spring of 2022. The NAEP is the only assessment that is given in every state and thus provides comparative information across the nation.

Figure 2. Average NAEP scale scores for U.S. States, 2022. Menus change views by grades and subject

Similar findings from state-level assessments

In a separate analysis of state-level assessment data, Alabama’s results have gotten national attention. An analysis produced by educational researchers and shared with al.com showed that Alabama school districts showed greater stability and improvement from 2019 to 2022 than schools in much of the rest of the country.

Researchers at The Educational Opportunity Project at Stanford University and the Center for Education Policy Research at Harvard University collaborated to publish and analyze the Education Recovery Scorecard Project, the first district-level view of changes in academic performance from 2019-2022. Several Alabama systems are among the top performers for improvement over the period, including Boaz, Piedmont, Andalusia, Arab, Cullman, Muscle Shoals, Hoover, Hartselle, Pike Road, Vestavia Hills, and Mountain Brook.

Alabama rising?

Since 2003, Alabama students have ranked at or near the bottom in math on the NAEP in both grades tested, 4th and 8th. In reading, Alabama 4th graders had improved enough to meet the national average by 2011 but drifted downward in subsequent years. Alabama 8th-grade reading scores have been in the bottom five consistently.

In 2019, Alabama 4th graders ranked No. 51 in math compared with students in other states and the District of Columbia. In 2022, Alabama 4th graders ranked 39th. In reading, Alabama 4th grade student performance rose from 48 to 38.

Average scale scores for Alabama 8th graders declined in both reading and math. However, other states experienced steeper drops in math, so Alabama’s rank climbed from 51 to 46. In 8th-grade reading, Alabama maintained its rank of 48 out of 51.

Figure 3. Scale score rank of states, by grade and subject

The improvements in 2022 indicate some progress, but Alabama has a long way to go before it is providing a nationally competitive education to all students. In the 2022 results, students in Mississippi once again scored ahead of Alabama in both reading and math at both grade levels. Alabama did close that gap with Mississippi in math and in 4th-grade reading, but the gap widened in 8th-grade reading.

Figure 4. Alabama, Mississippi, and U.S. NAEP scores compared

Results coincide with investments

The positive results coincide with the recent infusion of money and effort in early grades reading. The Alabama Literacy Act in 2019 was accompanied by increased funding for the Alabama Reading Initiative (ARI). ARI provides professional development and support for teachers. The state also requires a dedicated reading coach to work with K-3 teachers. The coach and teachers monitor reading data, identify struggling readers, and provide enhanced support. That includes providing services from specialists trained to diagnose and work with children with learning challenges like dyslexia.

In math, Alabama realigned its math standards in 2019, with one of the aims being to align better with national expectations represented by the NAEP. The Alabama Math and Science and Technology Initiative (AMSTI) also altered its tactics, allowing it to reach more schools and teachers. Extra federal relief money also allowed some districts to hire math coaches to work with teachers. In 2022, the Alabama Legislature passed the Alabama Numeracy Act, which provides increased funding and calls for a strategic approach to improving math performance, borrowing some of the approaches deployed to support literacy.

PARCA showcased investments in AMSTI, ARI, and Mississippi’s approach to educational improvement at the PARCA Annual Forum in March of 2022. The Forum webpage provides recordings of the presentations, more information, and resources.

While the gains on the NAEP in 4th-grade reading and math might not be statistically significant, those results mirror improvements Alabama students posted on the Alabama Comprehensive Assessment Program (ACAP), the state’s standardized test. Compared to 2021, the state saw gains, particularly in early grades mathematics.

Comparing NAEP to Alabama’s test of proficiency

Alabama has administered several different achievement tests over the past decade, which leads to confusion about how Alabama students are performing. Complicating the picture is that the different tests, including the NAEP, have different measures of proficiency. Figure 5 compares the results of the 2022 NAEP with the results of the ACAP, also given in the spring of 2022.

The results of both tests are expressed in terms of the percentage of students who scored proficient or above on the tests.

The bars in red represent the percentage of Alabama students scoring proficient on the NAEP and on the ACAP at both grade levels and in both subjects.

The green bars present the percentage of students in the U.S. that scored proficient on the NAEP.

Figure 5. Scores from Alabama’s ACAP vs. NAEP, 2022, by subject and grade

Comparing NAEP and ACAP results, it is apparent that Alabama’s ACAP English Language Arts assessment is much more generous when it comes to grading student proficiency in English.

In contrast, ACAP produces results similar to NAEP’s in math.

Except for the ELA scores on the ACAP, both tests indicate that only somewhere around 20-30% are reaching proficiency. The National Assessment Governing Board sets proficiency levels and describes them as follows: “Students performing at or above the NAEP Proficient level on NAEP assessments demonstrate solid academic performance and competency over challenging subject matter.” They specify that the NAEP Proficient achievement level does not represent “grade level proficiency” as determined by other state assessment standards.

Figure 6 presents three levels of achievement on the NAEP: the percentage of Alabama students scoring “at or above Basic,” the percentage scoring “at or above Proficient,” and the percentage of students scoring “Advanced.”

Figure 6. Percentage of Alabama Students at each NAEP Achievement Level, 2003-2022

In 4th grade reading and math, students today are ahead of where they were a decade ago: a greater percentage of students are scoring above basic, above proficient, and at the advanced levels.

In 8th-grade math, there has been some progress, while 8th-grade reading gains seen in 2015 and 2017 have fallen away substantially.

Conclusion

The NAEP and the ACAP have provided evidence that Alabama educators and students can improve even in challenging circumstances. The investment and attention to early grades reading and mathematics need to be sustained and accelerated. Alabama has a long way to go to catch the national average or even our neighboring state, Mississippi.

But even as further gains are pursued for younger learners, Alabama needs to find ways to sustain learning gains into middle and high school. The erosion in proficiency in the middle grades could have lasting negative effects in preparing students for high school, college, and careers.


State Test Results Showed Across the Broad Improvement; Gaps Widened Though

Alabama public school students showed increased proficiency in math, science, and English at all grade levels and across virtually all demographic groups in the 2021-2022 school year, according to the recently released results of the statewide standardized test, the Alabama Comprehensive Assessment Program (ACAP).

Printable PDF available here.

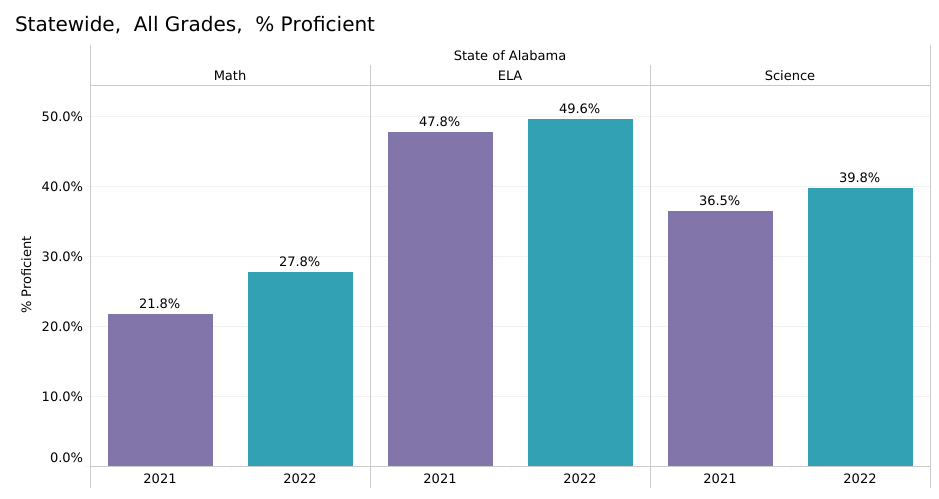
Figure 1. Proficiency By Subject (Grades 3-8), 2021 and 2022 compared

While the improvement is welcome, there is a long way to go.

Only half of students across the tested grades (3-8) scored proficient in English Language Arts (ELA). In math, only 28% of students were proficient. Students were tested in science in grades 4 and 8, and 40% of students were found to be proficient. A sub-set of the ELA questions is used to measure whether second and third-graders are “reading on grade level,” a different measure than proficiency. Those results, released by the state department this summer, showed that 22% of third-grade students were below grade level in reading.

This is the second year students have taken the ACAP as the statewide standardized test. Developed specifically for Alabama, ACAP is not taken by students in other states. Comparing ACAP scores to scores on previous assessments (ACT Aspire, Scantron), ACAP finds similar though slightly higher proficiency rates in ELA/Reading as previous statewide standardized tests found. The one national benchmark test, the NAEP, has historically graded tougher, with reading proficiency rates about half what other assessments show. In Math, ACAP seems to be the toughest measure of all, with scores in the range of but slightly lower than NAEP. Past statewide assessments have tended to grade student math proficiency more generously.

A Rebuilding Year

The 2021-2022 school year marked a return to closer-to-normal conditions compared to the 2020-2021 school year, which was marked by the disruptions from the Covid-19 pandemic. Improvements were seen not only across all subjects and all grades but across almost all school systems.

Looking at the results by subject and grade, improvements were strongest among the youngest students. The gains were highest in early grades mathematics, a welcome development considering Alabama students’ long-term poor performance in math. The math proficiency rate among third greater increased by 9 percentage points and by seven percentage points in grades 4-6. With urging and support from the Legislature, the Alabama Department of Education is putting additional emphasis on early grades mathematics. The early grade gains show promise. However, the percentage of students scoring proficient in math declines sharply in the upper-grade levels, as it has for years.

ELA scores are also highest in those early grades, with a drop after fourth grade, then a recovery in 8th. In response to the 2019 Alabama Literacy Act, schools and systems statewide have been providing an unprecedented level of professional development for reading instruction for teachers in Grades K-3. As one might expect, growth in ELA scores from 2021 to 2022 was highest in Grade 3.

Figure 2. Proficiency by Grade, 2021 & 2022 compared

Results by Subgroup

Most subgroups of students showed improvement, with the strongest gains being among White, More than One Race, and Asian students. While Black, Hispanic, and economically disadvantaged students all posted gains, the higher level of increase among White, More than One Race, and Asian students led to a widening of the score gap between the groups. Nationally and within the state, evidence indicates that systems serving economically-disadvantaged and minority students tended to be harder hit by the pandemic and were slower to return to normal functioning as conditions improved. That may play some part in explaining the disparity.

Figure 3. Proficiency by Subgroup, 2021 & 2022 compared

Proficiency in Context

In general, systems with low rates of economic disadvantage tend to have a higher percentage of students scoring proficient. Schools and systems with higher concentrations of economic disadvantage tend to have lower rates of proficiency. This pattern is consistent nationally across most standardized tests. The economic disadvantage for a system or school is measured by the percentage of students who automatically qualify for a free lunch under the national school lunch program.

The chart below presents school systems according to both their rate of proficiency (the vertical axis) and their rate of economic disadvantage (the horizontal axis). Systems with higher rates of proficiency are higher above the baseline, while the systems to the left of the chart have high rates of economic disadvantage, with economic disadvantage decreasing as you move right. The line sloping up to the right represents the relationship between the two variables and predicts where the proficiency rate of a system at a given level of economic disadvantage. Thus, systems above the line of prediction are performing better than predicted given the level of poverty among students.

Piedmont City Schools, for instance, generated an overall proficiency rate of 60% despite having 54% of students qualifying for a free lunch. That compares to a 2022 state average proficiency across all grades and all subjects of 38% and an average economic disadvantage rate of 41%.

Figure 3. System Proficiency in the Context of Poverty, 2022

So, when comparing results, the economic and demographic composition of the school and system should be taken into account. However, examples like Piedmont’s show that demographics don’t predict destiny. Piedmont was particularly well positioned to cope with disruptions of the pandemic and continue academic progress, thanks to its pioneering experience in digital education delivery, as described by PARCA in a 2021 report.

Using the same approach to present proficiency results for schools, the relationship between proficiency and economic disadvantage levels is still there, but it is not as determinative, with greater divergence from the line of prediction. That provides further evidence the efforts of educators and communities can make a difference.

Use the menus provided to explore the data or to highlight schools and systems of interest.

Figure 4. School Proficiency in the Context of Poverty, 2022

Beyond proficiency

Student scores on the ACAP fall into one of four levels. According to the scoring system, Level 4 students have an advanced understanding of grade-level standards. Students scoring on Level Three have a strong understanding of standards. Students on Level 2 have a partial but incomplete understanding of grade-level standards, while students scoring on Level 1 demonstrate minimal understanding of the material for the grade level.

Figure 5 presents the percentage of each system’s students that earned scores at each level. Two lines are presented for each system, allowing a comparison of the 2021 and 2022 results. Overall state results are at the top for comparison.

Figure 5. Percentage of students scoring at each level by system

Figure 6. presents the same information on student levels for individual schools. Menus allow the selection of systems. When comparing schools keep in mind the socio-economic mix of the students being served, as well as the school’s status as a magnet or charter school. Results for schools where students are selected or self-selected should be understood in that context. It is also important to remember that schools can change from year to year. Some schools may close or merge with other schools. New schools may open. Grade levels may be added or removed. Any such changes need to be considered before drawing conclusions about performance.

Figure 6. Percentage of Students scoring at each level by school

Large Performance Gains

In 2022, the system that showed the highest overall percentage point gain was Cullman City School, with an 11.6 percentage point gain in proficiency in all subjects combined.

Cullman’s gains were particularly strong in math. Jumps were seen in all grades ranging from a 14 percentage point gain in 8th grade to a nearly 27 percentage point gain in fourth grade.

Superintendent Kyle Kallhoff attributed the success to teachers, students, and parents. Cullman invested federal relief and recovery money in four math coaches across its five schools. Those coaches received intensive summer training from the state department of education’s Alabama Math Science and Technology Initiative (AMSTI). They continued to receive AMSTI support throughout the year.

With support from the coaches, teachers and students began engaging in number talks, a way of discussing math problems that encourage students to develop mathematical reasoning skills. Cullman teachers also recognized that the rigor of Alabama math standards required them to supplement their math instruction to ensure the standards were covered. to make sure that the math standards were covered.

Teachers paced lessons so that the match standards were covered by April, which allowed time for review and targeting of areas where students needed additional support.

Figure 7. Cullman City Math Proficiency Gains

Explore the data

PARCA provides its analysis and visualization of the ACAP data for the benefit of school leaders and teachers, for parents, and citizens at large. The tabs in the visualizations provide a variety of ways to evaluate relevant data. Use the “full screen” option at the bottom right of the visualizations to access a larger view of the data.

Comparative data is useful for understanding performance in the context of your community and the state. Comparisons over time and with similar schools can be useful in gauging your school’s progress and identifying areas where improvement is needed.


Alabama Population Dynamics and Workforce

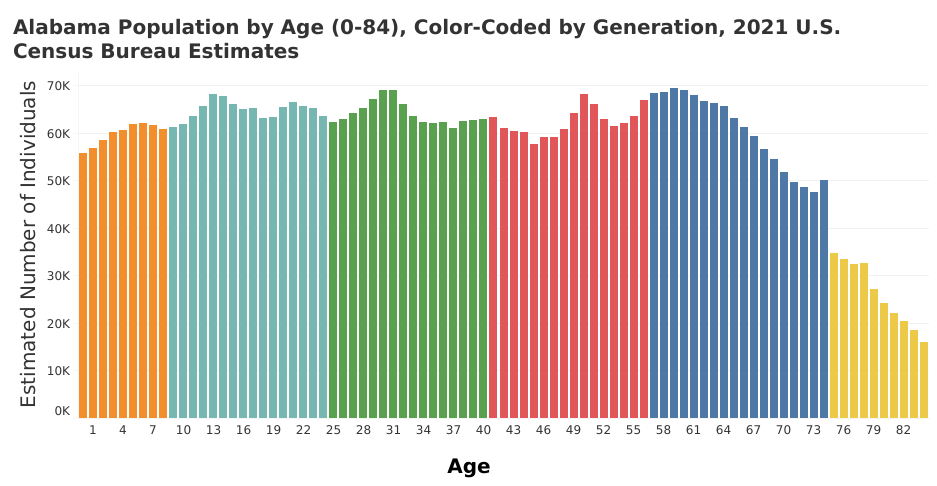
Absent immigration from other states or from abroad, Alabama’s working-age population is on track to shrink in coming years, according to a PARCA analysis of new population estimates from the U.S. Census Bureau.

(Not represented in the graphic are the more than 85,000 Alabamians the Census estimates included in the 85 and older category).

The 2021 Census population estimates by age provide a preview of the number of individuals that will join the workforce and the number that will likely be leaving it. Two factors are conspiring to create downward pressure on the working-age population:

  1. Large numbers of aging Baby Boomers are likely leaving the workforce
  2. The smaller rising generations, Gen Z and Gen A, will provide fewer replacements for those retiring workers.

In 2021, the Census estimates there were 65,730 64-year-olds in Alabama vs. 63,125 18-year-olds, a difference of about 2,600.

In every successive year thereafter, the number of Boomers exceeds the corresponding Generation Z cohort.

The gap widens significantly when today’s 11 and 12 years reach the age of 18. In 2008, with the advent of the Great Recession, birth rates fell. And they haven’t recovered.

Even when the Baby Boom has moved out of the prime working years, the number of potential leavers will outnumber new entrants, based on the current age structure of the Alabama population.

Considering only the current population, over the next 18 years, Alabama’s population between the ages of 18 and 64 will drop by a cumulative total of more than 50,000.

However, current residents only make up part of the story. Population growth is also influenced by migration and birth and death rates. Labor force supply is also affected by migration, by labor force participation, and indirectly by educational and skills attainment.

In terms of the natural population increase, Alabama has already seen two successive years in which deaths exceeded births. In 2021, about 8,500 more people died than were born, according to the estimates. This is due to the larger number of people moving into old age and the elevated death rates associated with the Covid-19 pandemic.

In terms of migration, changing patterns are affecting population and labor supply. From 2010-2016, most of Alabama’s population growth came through international immigration, with the state annually adding about 10,000 new residents who had been born abroad.

Since 2018, international migration has dropped, but domestic migration has increased.

In recent years, Alabama has enjoyed a net positive inflow of residents from other states, about 20,000 new residents a year from that source.

With unemployment low and demand for workers high, Alabama may continue to attract new residents through migration. But at the same time, the state is trying to increase the quality and the quantity of Alabama’s homegrown labor force:

  • By improving the education and training of the rising generation so that they are equipped for 21st-century jobs
  • By bringing Alabamians who’ve fallen out of the workforce back in

An array of state initiatives are underway to improve student preparation:

  • the expansion of First Class Pre-K
  • the Alabama Literacy Act
  • the expansion of Advanced Placement classes, high school/college dual enrollment, and the expansion of career technical education.

On the labor force participation front, through the Success Plus Initiative, the Alabama Workforce Council, the Governor’s Office, and an array of state agencies and participating nonprofits are collaborating on strategies to bring more people into the workforce training and education systems. The initiative seeks to address barriers individuals face to participating in the workforce and training. Through cooperation and outreach, the partners hope to reach discouraged workers and provide them pathways to high-demand fields.


Progress Made But Over 20% of Alabama 3rd Graders Not Reading on Grade Level

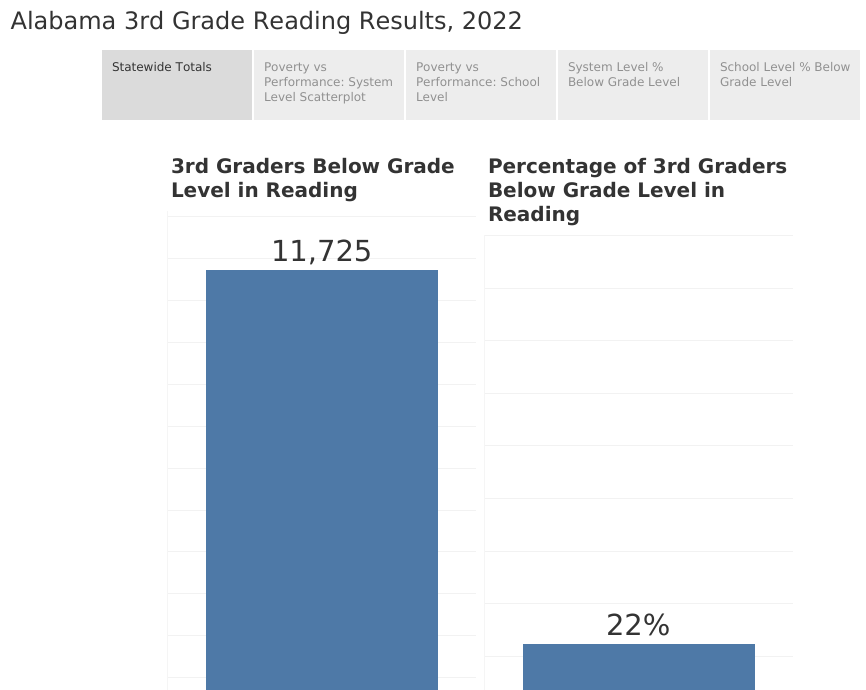
Fewer third graders scored below grade level in reading in 2022 compared to the previous year, according to results released by the Alabama Department of Education. Still, 22% or 11,725 students statewide failed to meet that critical educational milestone.

Printable PDF available here.

Learning to read by the end of third grade is considered fundamental to school success. Children not reading proficiently by the end of third grade are four times more likely than proficient readers to leave high school without a diploma. After third grade, teachers expect students to read in order to learn. In later grades, students without adequate reading skills struggle and have limited opportunities to make up the deficit. With early identification of reading challenges and research-based interventions, virtually all children can be taught to read.

The Alabama Literacy Act, passed in 2019, has sharpened the focus on early grades reading and directed coaching support and additional resources to support reading instruction based on the science of reading. The law now requires all schools to assess all students in reading from kindergarten through third grade. If a K-3 student is identified with a reading deficiency, the law requires the child’s parent or guardian to be notified of the deficiency within 15 days. The school is required to develop and implement an intervention plan for the student within 30 days. Identified students are to receive intensive support from specialists trained in the science of reading during school, before or after school, and over the summer until that student’s deficits are addressed.

“Each K-3 student who exhibits a reading deficiency or the characteristics of dyslexia,” the law reads, “shall be provided an appropriate reading intervention program to address his or her specific deficiencies. Additionally, students shall be evaluated after every grading period and, if a student is determined to have a reading deficiency, the school shall provide the student with additional tutorial support.”

“Each identified student,” the Act continues, “shall receive intensive reading intervention until the student no longer has a deficiency in reading.”

The 2022 results represent a slight improvement over 2021, when 23% of students scored below grade level on the reading portion of the Alabama Comprehensive Assessment Program (ACAP), the statewide standardized test administered to students each spring.

The Literacy Act will eventually require that, to be promoted to fourth grade, students must demonstrate that they can read at grade level (some exceptions apply). That provision of the Act was delayed by the Alabama Legislature in light of the Covid-19 pandemic. The children entering third grade this fall will not face the retention requirement. However, the rest of the law is in force. Schools and systems must identify and provide intervention services to children in grades K-3, including summer learning camps. All parents of second and third graders who scored below grade level on the reading portion of the ACAP should have been notified and should enter school this fall with a plan for remediation in place.

The percentage of students scoring below grade level in reading varied widely across the state. In general, systems with the highest levels of economically disadvantaged children also had the highest percentage of students not reading at grade level. The interactive chart below presents Alabama school systems arrayed on a scatter plot.

The vertical axis represents reading performance, with the best performers high on the chart (a high percentage of students reading at or above grade level and a low percentage of students below grade level).

The systems are arrayed on the horizontal axis moving from left to right, from the highest level of economic disadvantage to the lowest, from left to right. The size of a school system’s circle reflects the number of third graders scoring below grade in reading. The circle’s color corresponds with the level of economic disadvantage in the student body, from dark red representing high levels of poverty to dark green indicating low levels of poverty. In general, systems with rates of higher economic disadvantage had lower performance: a higher percentage of students failing to read at grade level. Systems with a lower rate of economic disadvantage had fewer students failing to meet the threshold.

However, particularly at the school level, it is clear that economic disadvantage is by no means an insurmountable obstacle. The correlation between poverty and performance is not as strong as in other educational data, like the ACT. In these third-grade reading results, schools with the same level of economic disadvantage show very different levels of success. Many high-poverty schools far outscored expectations.

In 2022, in more than 50 schools across the state, 50% or more of students ended third grade without the reading skills needed to succeed. Even at schools with a low percentage of students reading below grade level, the needs of the children with reading struggles must be met with “an appropriate reading intervention program to address his or her specific deficiencies,” as the law requires.

The Alabama act is patterned after similar laws in Florida and Mississippi, both of which saw significant performance gains after instituting their literacy laws. Alabama, which had enjoyed previous success in reading instruction in the 2000s through the Alabama Reading Initiative, has reinvested in reading coaches and professional development based on the science of reading for teachers and principals.

The following charts allow you to make comparisons of systems or schools, using the menus at the top of the chart to select the systems you want to focus on. First, a listing of systems:

Then, the percentage of third graders reading below grade level by school. The bars are shaded to reflect the percentage of students from economically disadvantaged households.

Even though the retention requirement of the Literacy Act has been delayed, the law is in force. But even if there were no law regarding third-grade reading levels, early grades reading should be a top priority.

Parents, teachers, and school and community leaders must respond to the identified need.


Alabama Public Opinion Survey 2022

With elections for governor and legislature pending in the fall, Alabamians are united in support for public investment in education and healthcare, divided on how to raise money for new investments, and express a preference for local leadership and decision-making. That is according to PARCA’s annual public opinion survey.

The poll of over 400 Alabama residents was conducted by Dr. Randolph Horn, Samford University, Assistant Vice President for Enrollment Research and Professor of Political Science. 

Results from this year’s survey are consistent with previous years’ results in some important ways.

  • Alabamians continue to rank education as the most important state government activity.
  • Large majorities of Alabamians say the state spends too little on education and healthcare.
  • Alabamians have an aversion to taxes but say upper-income residents pay too little.
  • A slim majority say budget surpluses should be reinvested in state services, specifically education, rather than used to cut taxes.
  • If budget surpluses are used to cut taxes, the most popular tax cut is the sales tax on groceries.
  • Alabamians are willing to pay more taxes to support education but do not agree on which taxes should be increased.
  • Alabamians are essentially split on tax-funded vouchers to pay for private school tuition. However, a majority believe vouchers, if allowed, should be available to all students.
  • Alabamians continue to believe that they have no say in state government and that government officials in Montgomery do not care about their opinions.

Results of the survey indicate many opportunities for officials to demonstrate responsiveness to public concerns and leadership in crafting public policy solutions.

Download the full report here.


2021 Kids Count Data Book provides roadmap for helping Alabama children

VOICES for Alabama’s Children published the 2021 Alabama Kids Count Data Book this month. For the 6th year in a row, PARCA provided the data and analysis for the project.

Since 1994, the Alabama Kids Count Data Book has documented and tracked the health, education, safety, and economic security of children at the state and county levels.

This annual statistical portrait is meant to provide a roadmap for policymakers who seek to improve the lives of Alabama’s children.
The Data Book can be used to raise the visibility of children’s issues, identify areas of need, identify trends and measure how previous efforts are working, set priorities in child well-being, and inform decision-making at the state and local levels.

Among the findings from this year’s data, VOICES points to the following challenges we must continue to address for Alabama’s children and families:

– Child Care: There are only 1,855 licensed child care providers in Alabama to support the workforce of today and tomorrow.  Lack of quality child care is a leading reason for decreased workforce participation. Further, babies need quality care and education as their parents work and their brains develop in pivotal years.

– Health: During a youth mental health crisis and increased family stress, there is 1 mental health provider available for every 923 Alabamians. The latest research shows that unaddressed childhood trauma and Adverse Childhood Experiences (ACEs) lead to lifelong chronic health issues, along with significant barriers to educational achievement and financial security.

– Economic Security: While 16% of Alabamians live in poverty, 23.9% of Alabama children live in poverty (ex. a household of 4 making $24,750 or less). Further, 1 in 5 children in Alabama are food insecure.

– Education: Poverty leads to significant disparities in education. For Alabama 4th graders in poverty, only 37.9% are proficient in reading and 12.1% are proficient in math.

–  Safety and Permanency: In 2021, 3,453 children entered foster care. While cases can have multiple causes of entry, 48% of cases involved parental substance abuse.

See how children in all 67 counties of our state are faring in education, health, economic security, and more.

Access the 2021 Alabama Kids Count Data Book here.


ACT Scores Down Only a Fraction For the Class of 2021, Despite Pandemic

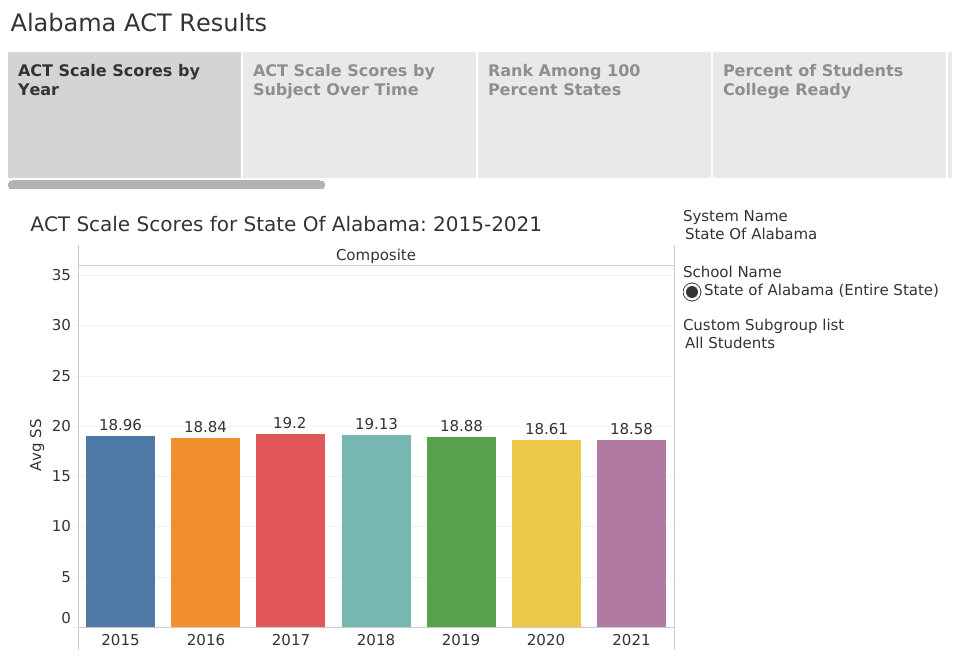
The average ACT score for students graduating from Alabama’s public high schools in 2021 was down only slightly, while the national average score fell more steeply, a fact that could be considered a victory in the light of the challenges faced by students and educators during the pandemic. Still, Alabama’s 2021 ACT results continue a downward drift from their peak in 2017.

Alabama’s average score, 18.6 on a 36-point scale, shouldn’t be directly compared to the national average score. Alabama tests virtually all its public high school students, while only 35% of students take the ACT nationally. In states where the test is not universally given, only students planning to go to college take the test, which tends to push up the score. The national average score fell from 20.6 in 2020 to 20.3 in 2021. Among states that tested 100% of students, Alabama maintained its relative performance rank, behind Kentucky, Tennessee, and Arkansas but ahead of Mississippi and Louisiana.

Downward pressure on scores was expected. The pandemic led to the cancellation of several administrations of the ACT. Schools across the country operated virtually during the spring of 2020 when the students in the class of 2021 were juniors. Altered forms of schooling persisted into the fall of 2020. In normal circumstances, some students take the test more than once, attempting to boost their scores. That happened less with the Class of 2021. According to ACT, only 32% of students took the ACT more than once compared to 41% of the 2020 cohort. That drop was likely because most universities suspended the requirement of taking the ACT due to the disruptions.

In addition to the fractional drop in the average scale score for Alabama students, the percentage of students scoring college-ready in all subjects declined. In 2021, only 15% of students scored at or above the college-ready benchmark in all four tested subjects, compared to 16.3% in 2020 and 18% in 2017. According to ACT, students who meet a benchmark on the ACT have approximately a 50% chance of earning a B or better and approximately a 75% chance of making a C or better in a corresponding college course. ACT is primarily geared toward measuring readiness at four-year colleges and universities.

On each of the four subjects that ACT tests — English, math, reading, and science — student scores ticked down a fraction.

Some points of interest arise when delving more deeply into the numbers. Scores for white students declined in every subject while Black students held steady in reading and science. Hispanic students posted an improvement in English and science. Scores rose for both economically distressed and non-economically distressed students, an unexpected result considering that scores overall were down slightly. That may be explained by more students being classified as economically distressed due to the lingering economic consequences of the pandemic. Some students who had typically been in the non-economically distressed category likely shifted into the economically distressed pool, which can push up the scores of the economically distressed pool.

The stubborn score gaps between economic and demographic subpopulations persisted in 2021. Asians outperformed all other subgroups.

Due to the score gaps between students from different backgrounds, the demographic composition of the student body should be taken into account when evaluating a school or system’s performance. The scatterplot presents score performance in the context of the economic composition of the school system’s students.

Systems with a high percentage of non-poverty students are on the right of the scale, while schools with high poverty percentages are on the left. The higher the average scale score for the system, the higher the system appears on the graph. The line of prediction plots the expected performance level for a system considering the economic composition of the student body. Scores increase as the percentage of non-economically distressed students increase. Systems are grouped along that line of prediction, indicating a correlation between the average scale score in the system and the economic makeup.

Systems above the prediction line have outscored expectations based on economics.

A similar pattern can be seen in the array of individual high schools. However, there is more variation from the average. Taken together, the graphs tell us that the socioeconomic composition of a school influences the average score, but that systems and, to an even greater degree, individual schools do make a difference in student performance.

Bearing that in mind, PARCA’s visualizations of the 2021 ACT results allow the viewer to explore how their local schools and systems performed relative to others. Viewers can choose schools and systems that provide appropriate peer comparisons. In addition to comparisons by average scale score, additional views offer results by the percentage of students achieving the benchmarks in each subject. Lower poverty systems serving suburban communities tend to show the best results at the system level.

At the school level, the highest average performance is found not just among those suburban systems but also in magnet high schools in larger systems, like Montgomery County’s Loveless Academic Magnet Program (LAMP) and Huntsville’s New Century Technology High School.

To put ACT scores in perspective, it is helpful to know the typical ACT scores for students entering college. Average scores range widely between colleges and within colleges. In Alabama, the mid-point ACT score for entering students ranges from 28 at the University of Alabama in Huntsville and Auburn University to 17 at Alabama A&M in Huntsville and Alabama State in Montgomery. As part of their mission, these historically-Black universities provide opportunity and access to students who may not have received the same level of college preparation. Many colleges have continued to waive the ACT requirement for admission and are instead relying on high school grades and other factors to assess student readiness. However, ACT scores can still play a role in admissions and in the competition for scholarships.


PARCA Annual Forum Resources

PARCA’s Annual Forum on March 11, 2022, focused on efforts to improve math and reading education instruction for students in Alabama and Mississippi. The program featured the Superintendents of Education for Alabama and Mississippi, with Alabama Gov. Kay Ivey delivering the keynote address.

Reading and Math in Alabama: The Data

PARCA Annual Meeting

Video of Opening Session

Presentation by Ryan Hankins PARCA Executive Director

Literacy: Our Path Forward

PARCA Annual Meeting

Video of literacy presentation and panel

Presentation by Cassandra Wheeler, Voyager Sopris/Lexia Learning and Laura Woolf, Voyager Sopris/Lexia

What About Math?

PARCA Annual Meeting

Video of the Mathematics presentation and panel

Presentation by Steve Leinwand, American Institutes for Research

Why School Mathematics in the 21st Century is Different — an explanation of why mathematics education needs to change.

A Vision of Effective Teaching and Learning of Mathematics — A description of what math education should be and how to bring it about.

Bridging for Math Strength — Online bank of math education resources for teachers and leads developed by the Virginia Department of Education and George Mason University.

Bed Time Math — free resource for parents offering ideas on how to incorporate math into everyday interactions with children.

Superintendents’ Conversation

PARCA Annual Meeting

Video of discussion between Dr. Eric Mackey, Alabama State Superintendent of Education, and Dr. Carey Wright, Mississippi State Superintendent of Education

Albert P. Brewer Legacy Lunch

PARCA Annual Meeting

Kay Ivey, Governor of Alabama

Video of introductory remarks and governor’s address

Additional Background Material

Literacy

Mississippi Resources

Mississippi’s Literacy-Based Promotion Act: An Inside Look, a study of Mississippi’s Literacy-Based Promotion Act (LBPA) with input from the Mississippi Department of Education and teachers around the state. A study by The Foundation for Excellence in Education (ExcelinEd).

Strong Readers, Strong Leaders, a bank of grade-level-appropriate resources developed for parents and community leaders to help teach children to read. Part of a public awareness campaign to promote reading.

Alabama Reading Initiative

Annual Report, Dec. 2021

ARI Website

Alabama Literacy Act Implementation Guide

The Alabama Family Guide for Student Reading Success

Math

Alabama Math Science and Technology Initiative

Annual Report, December 2021

AMSTI Research and Reports

Family Guide for ACAP Success: Elementary School Math

Additional Education-related Resources

The Alabama Education Lab by al.com, and its weekly newsletter, Ed Chat.

Forging Alabama’s Future: Improving Educational Attainment and Workforce Development, Business Education Alliance report on strategic investments to improve educational attainment and workforce quality and supply.

The Alabama Literacy Alliance, a network of literacy advocacy organizations and service providers from across the state.

A+ Education Partnership, latest news from the educational improvement advocacy group.