PARCA Partners with VOICES on 30th Edition of Alabama Kids Count Data Book

VOICES for Alabama’s Children published the 2023 Alabama Kids Count Data Book today, marking the 30th edition of the book published by the nonprofit. For the 8th year in a row, PARCA worked with VOICES as a data partner for the project.

Since 1994, the Alabama Kids Count Data Book has documented and tracked the health, education, safety, and economic security of children at the state and county levels.

For the 30th edition, VOICES also interviewed the directors of Alabama’s child-serving agencies and included excerpts.

The Data Book serves as both a benchmark and roadmap for how children are faring and is used to raise visibility of children’s issues, identify areas of need, set priorities in child well-being and inform decision-making at the state and local levels.

Below are some of the findings from this year’s data:

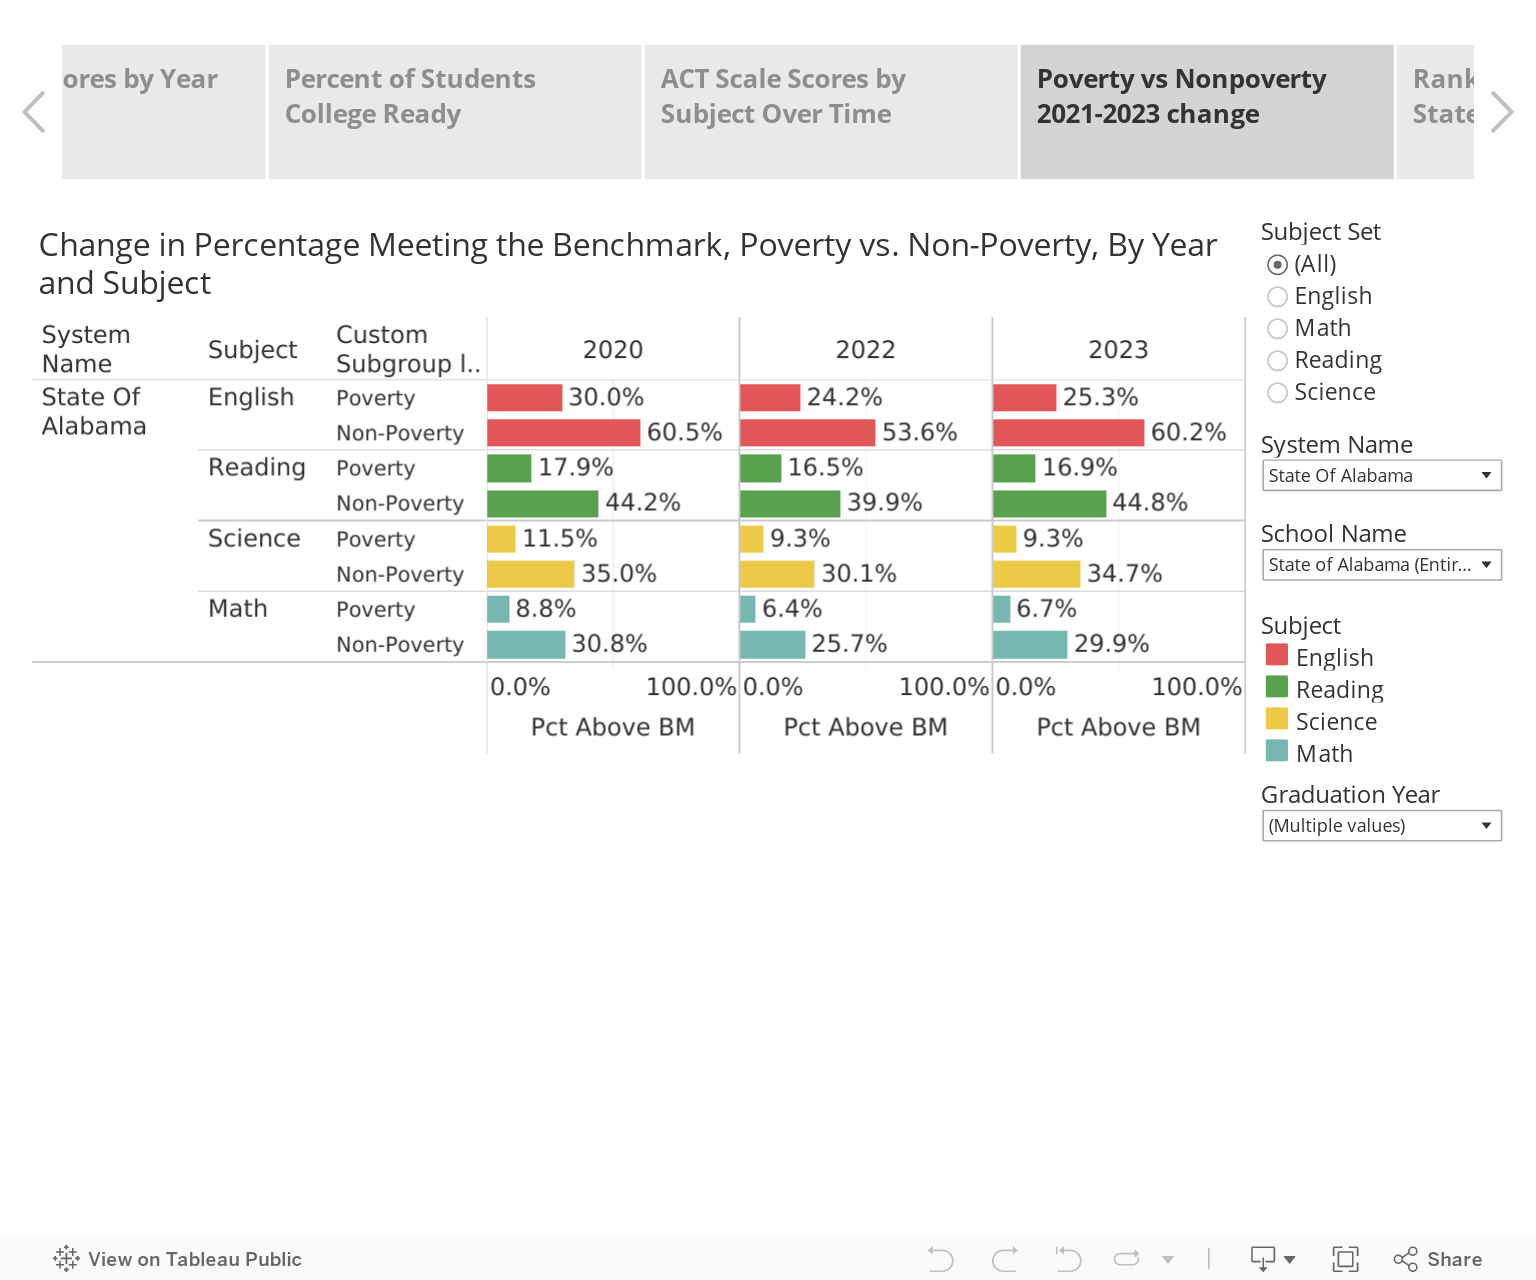
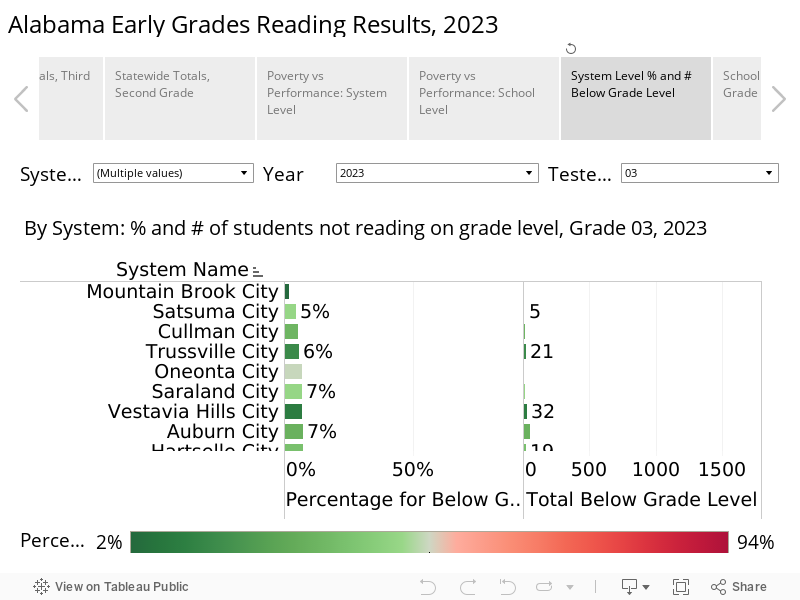
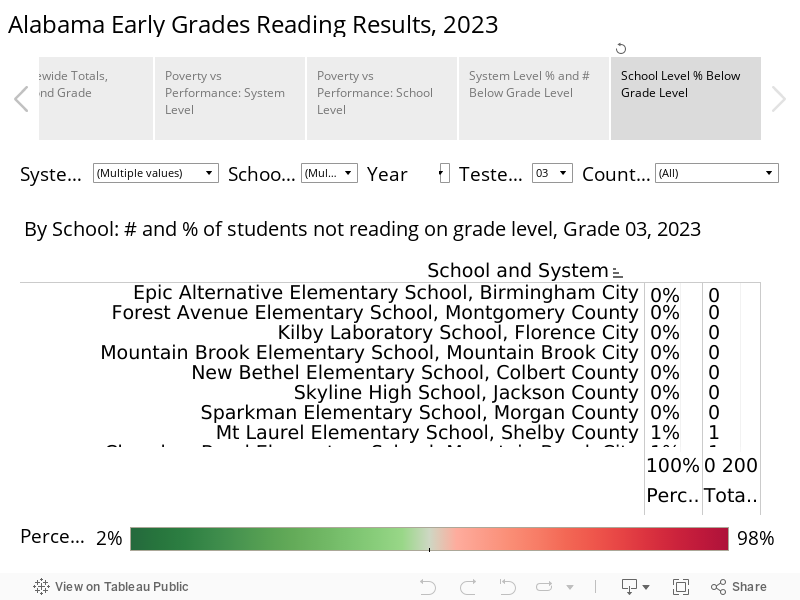
– Children of color and children in poverty are shown to have much poorer outcomes and much poorer achievements in education.

– Child population continues to decrease. Over the last year, the number of children grew in only 20 of 67 counties.

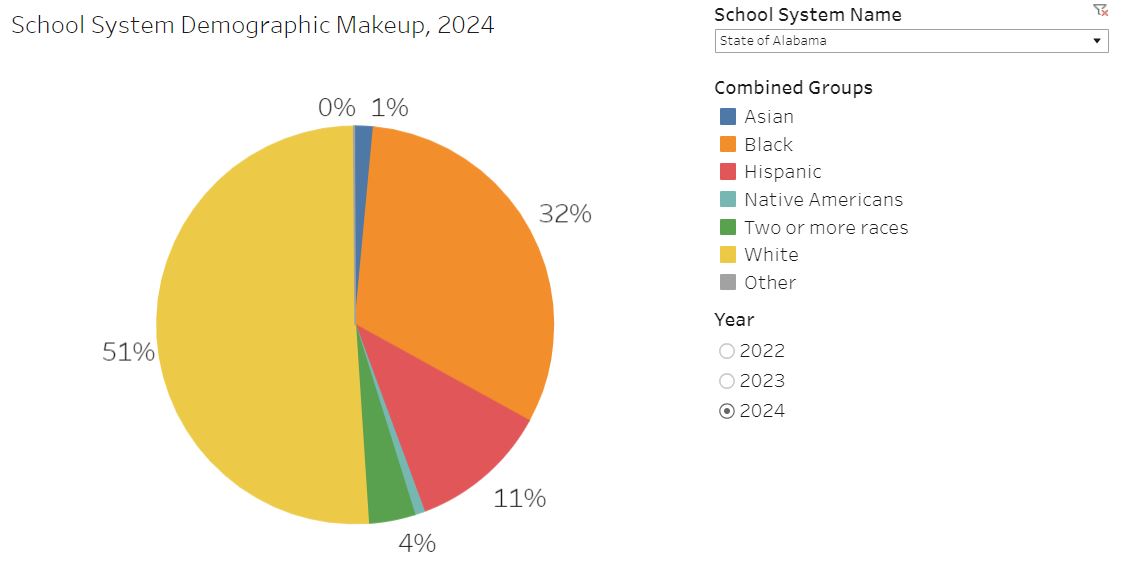
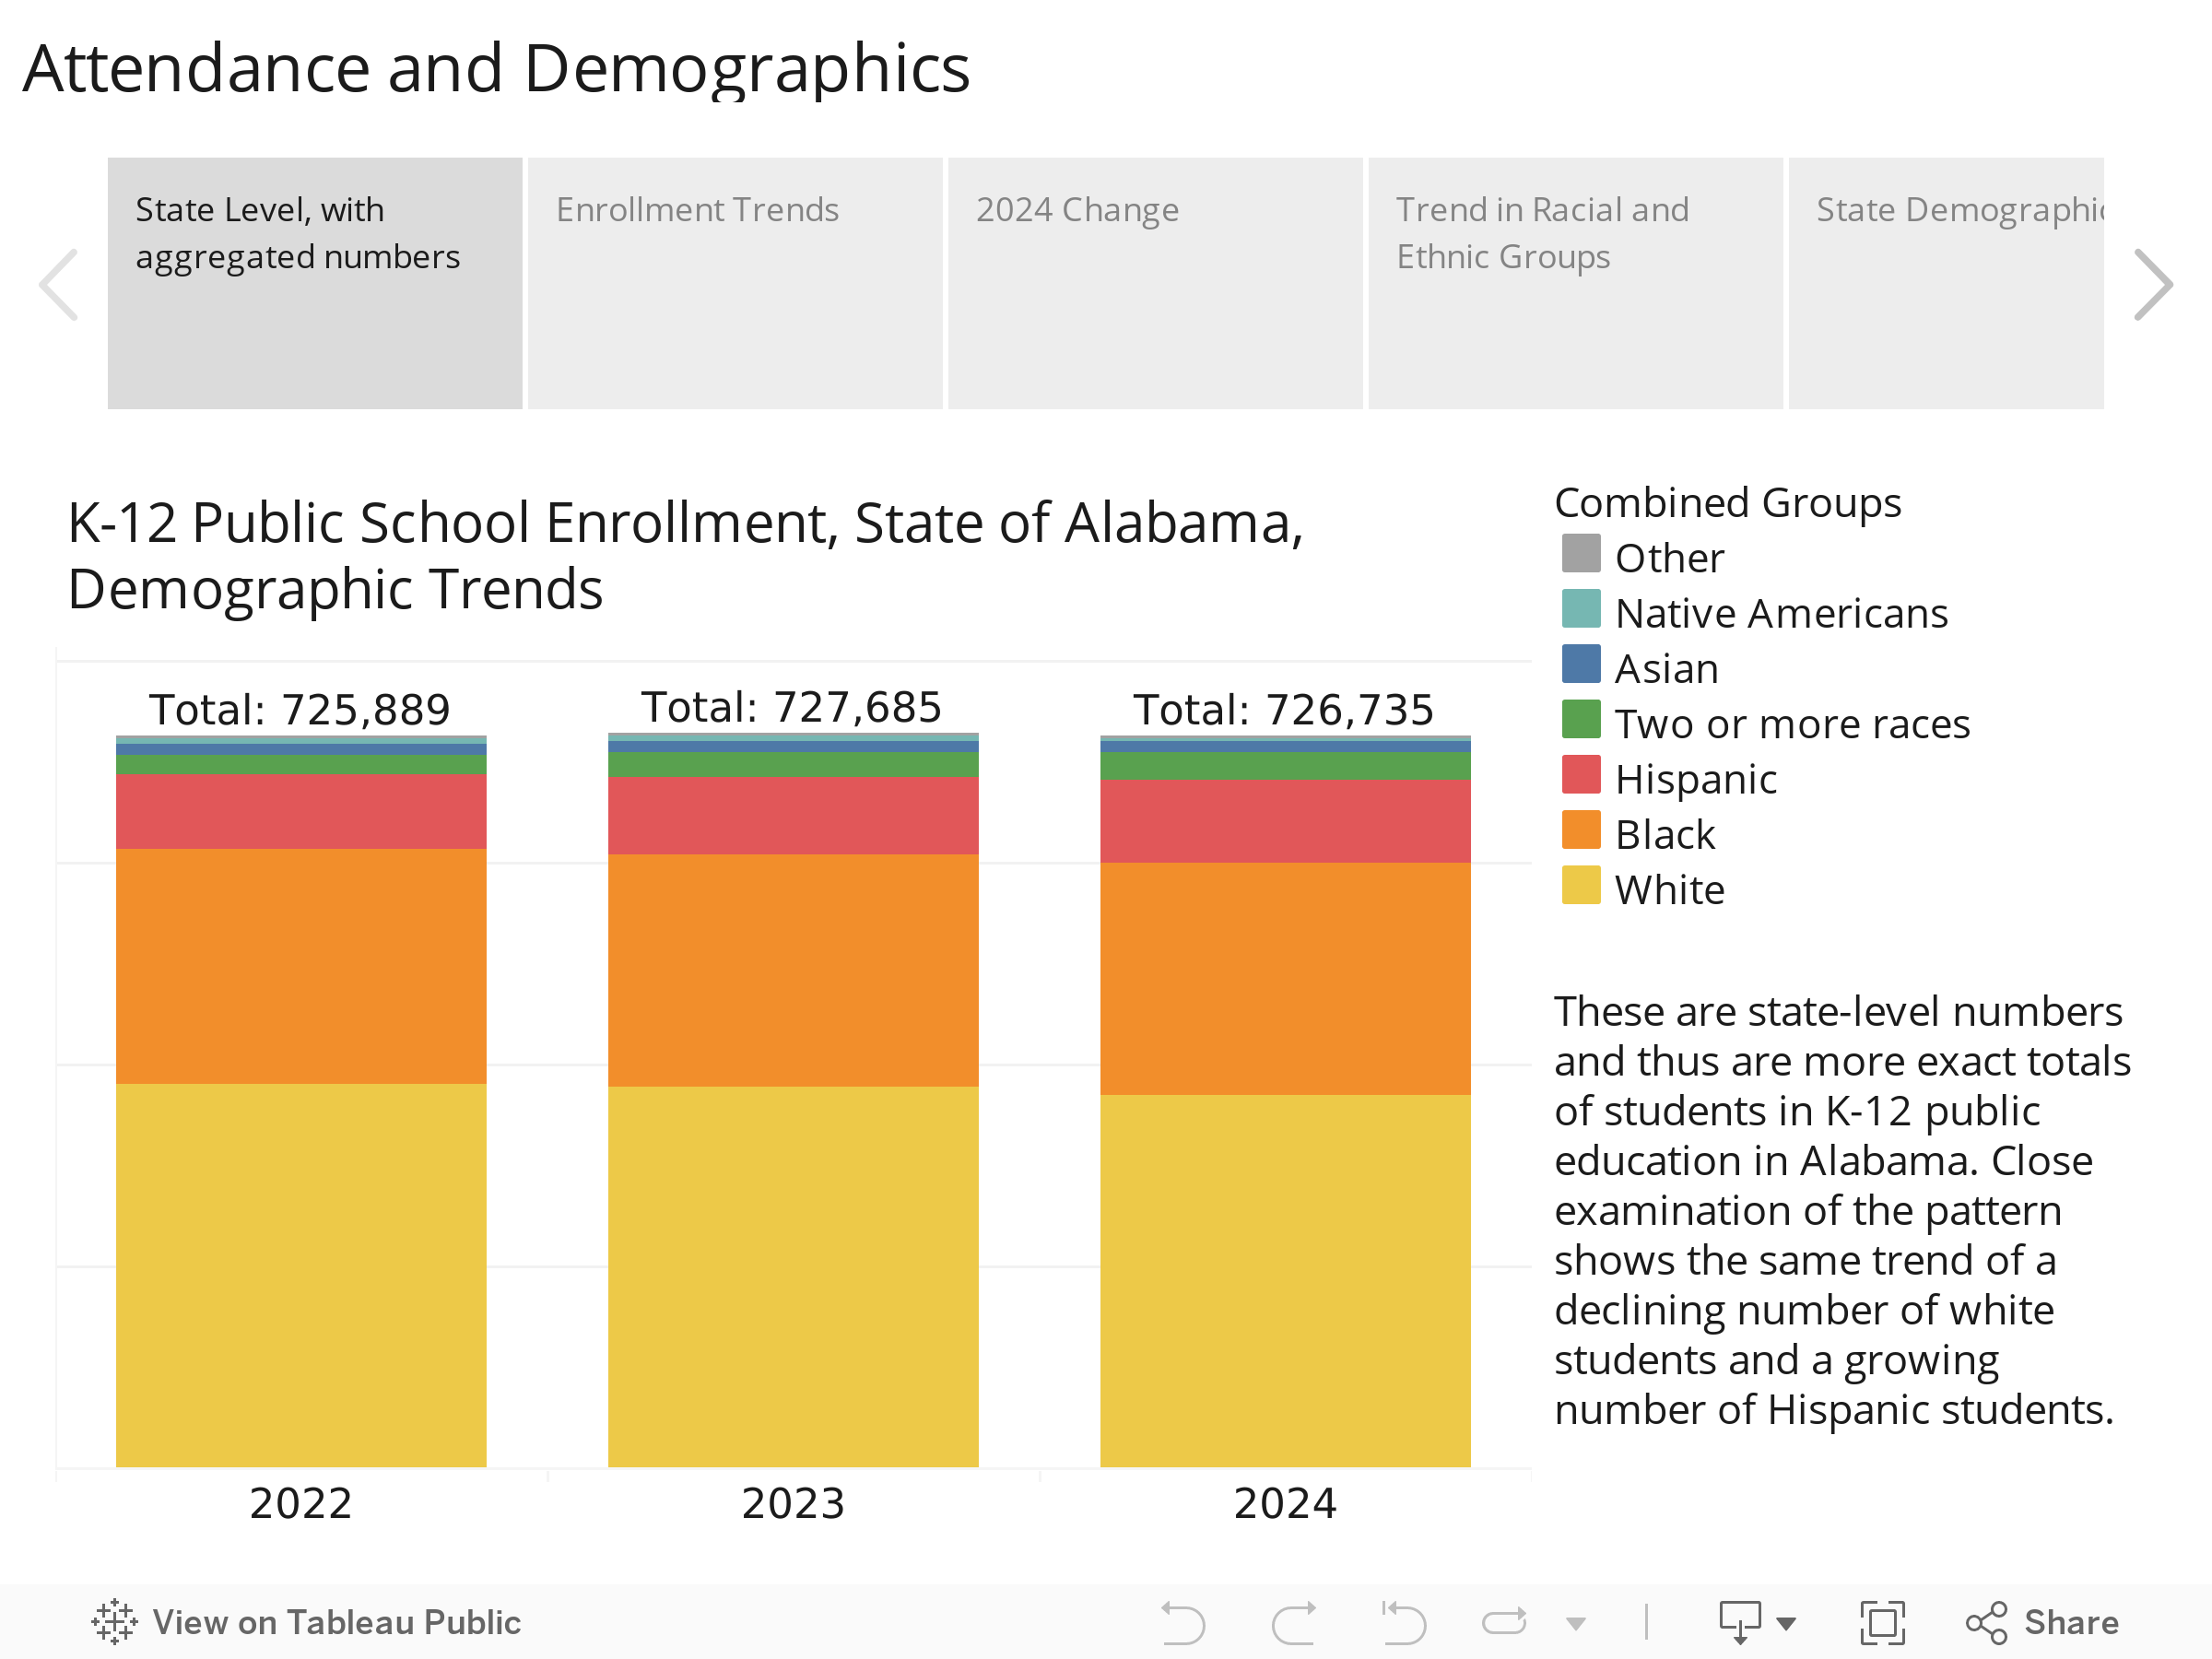
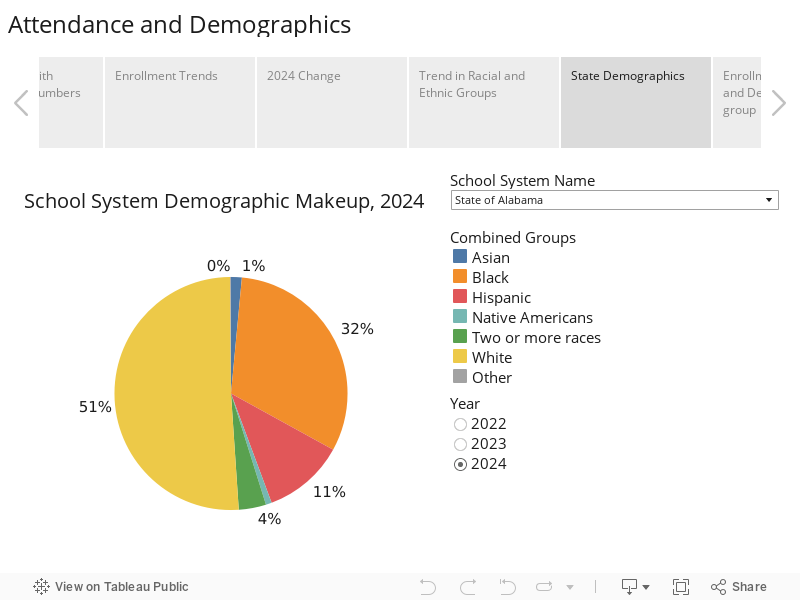
– Children in Alabama are becoming increasingly more diverse ethnically and racially. While white and Black child populations are declining, since 2000, Hispanic children grew approximately 276%. The Asian/Pacific Islander population grew by 120%.

– The infant mortality rate has slightly decreased from 8.1 to 7.6 per 1,000 live births from 2011-2021. In real numbers, that means that 443 babies did not live to their 1st birthday in 2021. Maternity care is critical. 34.3% of Alabama counties are defined as maternity care deserts. More than 28% of Alabama women had no birthing hospital within 30 minutes, which is more than double the U.S. rate.

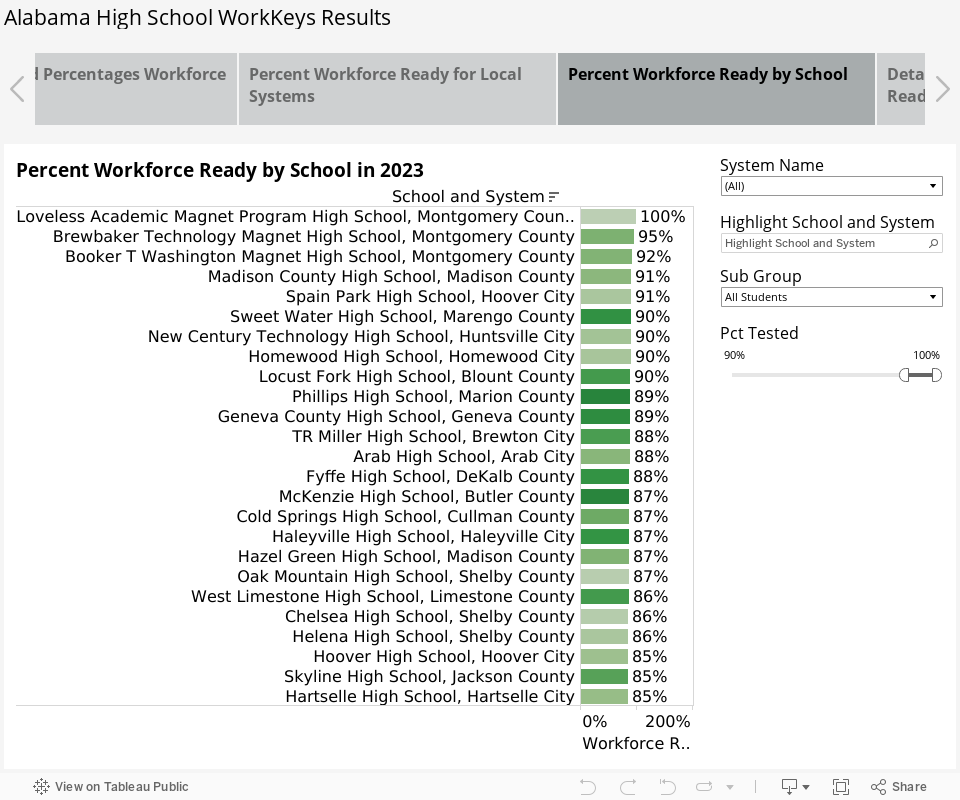
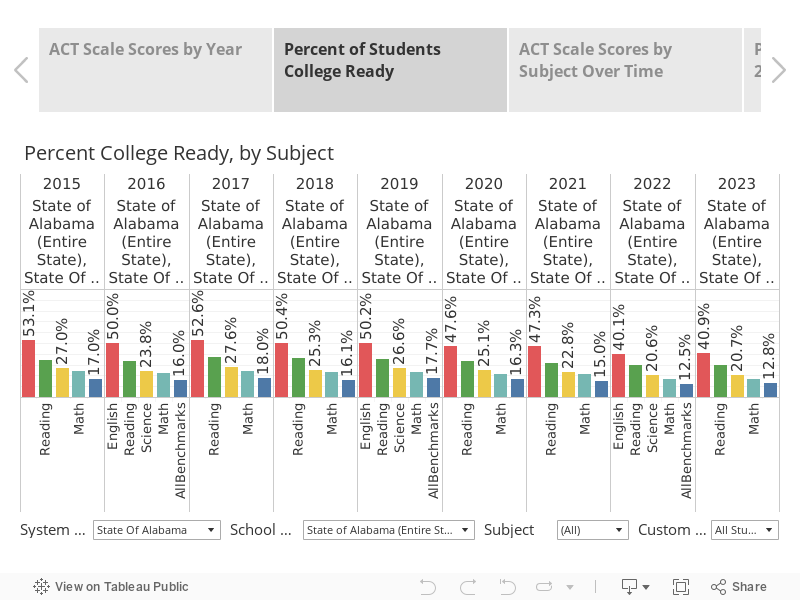
– In 2022, the percentage of Alabama high school students meeting college and career ready requirements was 79.1% from 76.5% in 2021.

– 2023 Work-based learning programs (Dual Enrollment and Career Training Programs) are estimated to have had an economic impact of $420,209,126.

– From 2015-2023 there has been a 16.9% increase in the number of children entering foster care services. Parental drug use is the leading reason for children entering foster care, making up 44%, followed by neglect at 22%.

– 10.4% of children in the state are living in extreme poverty. Black and Hispanic populations are disproportionately affected (38.3% and 36.7% respectively), while white children make up 13.5% of children in extreme poverty.

See how children in all 67 counties of our state are faring in education, health, economic security, and more. VOICES believers that every child in Alabama should have access and opportunity to thrive and become all they can be, and hopes that by utilizing this book’s insights, we can identify the challenges, set priorities, track our progress, and achieve real outcomes for children and families.

Access the 2023 Alabama Kids Count Data Book here.

Want to see this data at the national level? Visit the national KIDS COUNT Data Center to access hundreds of indicators, download data and create reports and graphics!


Alabama Public Opinion Survey

PARCA’s most recent public opinion survey finds, once again, aversion to certain taxes, support for public education, and mistrust in state government. At the same time, the survey finds a lack of consensus on how the state should respond to other critical issues.

Among the findings:

  • Alabamians continue to rank education as the most important state government activity.
  • Large majorities of Alabamians say the state spends too little on education and healthcare.
  • Alabamians have an aversion to taxes but say upper-income residents pay too little.
  • Alabamians are willing to pay more taxes to support education but do not agree on which taxes should be increased.
  • A plurality (48%) of Alabamians would prefer to educate their children in public schools.
  • A majority of Alabamians support school choice options.
  • A large majority believe private schools receiving state funds should meet all standards required of public schools.

PARCA’s annual public opinion survey was conducted between October 24 and December 26, 2023. The mixed-mode sample includes a mix of respondents from a statewide random digit dialed (RDD) sample of cell and landline numbers and an Internet panel provided by Qualtrics. The poll of over 500 Alabama residents was conducted by Dr. Randolph Horn, Samford University, Assistant Vice President for Enrollment Research and Professor of Political Science. 

Results of the survey indicate many opportunities for officials to demonstrate responsiveness to public concerns and leadership in crafting public policy solutions.

Download the full report here.


More Students Workforce Ready in the Class of 2023

The number and percentage of high school seniors graduating workforce-ready rose with the Class of 2023, according to the results of ACT’s WorkKeys Assessment, a test of skills given to public high school seniors. The results are another sign that student performance is recovering from post-pandemic lows, though the recovery is not complete.

Printable PDF available here.

The WorkKeys test measures practical math, reading, and graphical literacy skills as they are employed in the workplace. That’s different than the ACT, which tests for knowledge and skills needed in a college classroom. In 2023, 72% of seniors took the test statewide, and 62% of those tested scored at or above the silver level of workforce readiness.

Figure 1. WorkKeys Results, Statewide Trends

WorkKeys is optional, and school systems vary in the percentage of students tested. WorkKeys was given to all seniors through 2019, but the State Department of Education stopped mandating the test. Some systems still test all seniors. Some systems make the test an option for students who haven’t demonstrated college and career readiness by another measure. WorkKeys is one of seven options for demonstrating college and career readiness.

Figure 2. Numbers and percentages of participation and passing the workforce-ready benchmark

In addition, a student’s score on WorkKeys can be a recognized credential in the job market. Some businesses, particularly industrial employers, build WorkKeys into their hiring practices. Working with ACT, those employers have determined what level of proficiency, as measured by WorkKeys, is needed in particular jobs. Depending on their test performance, students earn a platinum, gold, silver, or bronze National Career Readiness Certificate. A student scoring Silver or above has the foundational skills for 67% of jobs that ACT has profiled, and that student is considered college and career-ready by the Alabama Board of Education.

Figure 3. Percentage of all students workforce ready (scoring Silver or Above), by system, 2023 (Pictured are systems in which 90% of students were tested. Adjust filter to see other systems)

In Figure 3, the school systems are shaded by the percentage of economically disadvantaged students in each system. In general, systems with higher poverty percentages tend to have lower percentages of students scoring workforce ready. However, on WorkKeys, the correlation is not nearly as strong as it is with other measures, like the ACT college readiness test. WorkKeys seems to provide a more even playing field for comparative performance.

However, the 2023 WorkKeys test results do show a pattern similar to other assessments in the wake of the Covid-19 pandemic. After dropping in 2020, 2021, and 2022, WorkKeys results rebounded more strongly among nonpoverty students in 2023. In contrast, students from low-income backgrounds have been slower to recover to pre-pandemic levels.

Figure 4. Percentage Workforce Ready by School, 2023

The visualization below presents the results in a more detailed fashion. Each color represents the percentage of tested students scoring at each level: platinum, gold, silver, bronze, and no certificate earned. Use the menus to adjust the comparison and use the various tabs, to explore different aspects of the data.

Figure 5. WorkKeys Results, by level of certification, by system, 2023

Alabama ACT Scores Climb

ACT Scores for Alabama public high school students improved in 2023, bucking a downward trend nationally and providing another clue that Alabama schools began recovering from the Covid-19 pandemic more quickly than schools nationally. Students in the graduating class of 2023 were in ninth grade when the COVID-19 pandemic reached the U.S.

Printable PDF Document Available Here

Figure 1. Alabama Public High School Average Composite Scores, 2015-2023

Alabama’s Class of 2023 still trailed the score levels of classes tested prior to the academic disruptions wrought by COVID-19. The average composite score in 2023 was 17.72 on the ACT’s 36-point scale, up from 17.69 in 2022 but down from 18.58 in 2021.

The percentage of test-takers who achieved ACT’s college-ready benchmark in all four tested subjects – English, reading, science, and math – climbed to 12.8%. According to ACT, students scoring at or above the benchmark on a subject test have a 50% chance of earning a B in an introductory college course in the subject and a 75% chance of earning a C.

Figure 2. Percentage of students scoring at or above the college-ready benchmark in 2023, by subject

The scores of students from low-income households fell further during the pandemic and have not recovered to the same extent as students from non-poverty households.

The percentage of non-poverty students who were college-ready in reading was higher in 2023 than in the graduating Class of 2020. In English and science, the non-poverty students in the Class of 2023 had nearly closed the gap. In math, non-poverty students still have some catching up to do.

In comparison, the percentage of economically disadvantaged students who scored college-ready in 2023 remains significantly lower than pre-pandemic levels.

Figure 3. Comparing Poverty and Non-poverty Students’ College Ready Percentage, by subject, by selected years

Compared to other states

Nationally, a shrinking percentage of students of students were college-ready in 2023. In all four subject areas, the percentage of students scoring at or above the college-ready benchmark was the lowest in recent history. The average Composite score declined by 0.3 points, from 19.8 in 2022 to 19.5. Immediately before the pandemic, the U.S. average ACT composite score was 20.7 in 2019. While Covid led to sharp drops in scores, the national average score on the ACT has been trending down for several years. In 2017 and before, the national average composite was 21.

Comparing Alabama’s average composite score to the national average isn’t appropriate because of the difference in the universe of test-takers in different states. All Alabama public high school students take the ACT. In many states, only college-bound students take the test. Other states focus on the SAT instead, leaving only a small portion of students to take the ACT.

Looking strictly at the states where 100% of students took the test, the average composite score was 18.3, compared to Alabama’s 18 (When it comes to state-to-state comparisons, ACT provides a different state average than the data strictly focused on Alabama public school students).

Data provided by ACT and accessible through ACT’s online dashboard indicates that White students in Alabama have caught up to and scored at the same average as White students in other 100% states. However, Black and Hispanic students in Alabama haven’t regained as much ground. There also appears to have been a steep jump in the percentage of students scoring in the lowest ranges of the test. The percentage of Alabama students who scored 15 or below jumped from 34% to 41% during the pandemic.

Figure 4. Trends in the percentage of ACT test-takers in score ranges US vs. Alabama

Focus on Alabama Scores

Alabama students’ average scores improved in reading, English, and science but not math.

Figure 5. Trends in scale scores by subject

System Level Results

At the school system level, systems with a higher proportion of non-poverty students post higher average scores. Systems with a higher concentration of poverty post lower average scores.

Using the menu options on the right of the visualization, you can adjust variables to see the data through different lenses. Figure 6 presents the average scale score of non-poverty students in each system. Applying this different lens helps identify high-performing systems where higher poverty percentages might affect overall performance. More than half of the students in systems like Brewton, Huntsville, Haleyville, Jasper, and Demopolis are economically disadvantaged. But the Non-poverty students in those systems post average scores that rank them in the top 20 of school systems,

Figure 6. Non-poverty student’s average scores, by system

Meanwhile, Figure 7 compares the average scale score of economically disadvantaged students attending the various systems. Again, this different lens reveals a different set of high-performing schools. More than 40% of students in Satsuma, Saraland, Arab, and Oneonta are economically disadvantaged, and yet economically disadvantaged students there score higher than the all-students average statewide. Economically disadvantaged students make up more than half the student body in Brewton and Winfield, but despite that concentration, the system average for students in poverty ties or beats the state all-student average.

Figure 7. Economically Disadvantaged Students’ Average scores, by system

Examining results at the school level is also important for identifying high performance. Figure 8 presents the average scores of Black students by school. The highest average scores are found in Montgomery, Birmingham, and Huntsville magnet schools.

Figure 8. Black students’ average scores, by school

Use the menus and tabs to explore data on your own, find your school or system, and make comparisons keeping in mind student body socioeconomic composition. Available data options include:


Shifts in Public School Enrollment Seen in the 2023-2024 Fall Attendance Data

Alabama’s public school enrollment is down slightly for the 2023-2024 school year, with a decline in the number of white students enrolled, partially offset by a growing enrollment of Hispanic students. Just over half of public school students, 51% are white, 32% Black, and 11% Hispanic. This year’s enrollment continues a long-term trend. In 2000, 62% of students were white, and the percentage of Hispanic students barely registered.

The percentage of students identified as economically disadvantaged is at an all-time high, with 60% of enrolled students directly qualifying for a free lunch under the National School Lunch program. Qualification is based on having a household income that qualifies for federal benefits like housing, food, or health care support. The percentage of children identified rose substantially after Alabama’s Medicaid program began working with the Department of Education to identify students who qualified for Medicaid and related benefits. Coming out of the Covid pandemic, the number of families and children is elevated. Federal law prohibits states from removing patients from Medicaid rolls during a public health emergency. With the public health emergency now over, Medicaid is reassessing which households remain eligible.

The school systems seeing enrollment gains are generally found in places where the population is growing: north Alabama systems in and around Huntsville and to the south in Baldwin County. Growth in enrollment is also occurring at public charter schools that are starting up or adding grades. School systems offering online or virtual school programs have also shown gains. Read Al.com’s reporting on trends in school populations.

Rural systems saw the largest declines in percentage terms. Large county and city systems in Mobile, Montgomery, Shelby County, and Birmingham accounted for the larger numeric declines in enrollment.

Use the tabs to explore data, for your local schools and systems.


How Alabama Taxes Compare, 2023

Despite the wild gyrations in the economy since the outbreak of COVID-19 in the spring of 2020, the latest comparative data from the U.S. Census Bureau finds Alabama in a familiar position: at or near the bottom in state and local government tax collections.

Key Findings

• Alabama is a low-tax state: In FY 2021, adjusted for population, Alabama collected less in state and local taxes than all but one other state. Alaska, thanks to disruptions in the oil market over the period, had the lowest per capita revenues.

• Alabama’s per capita property tax collections are the lowest in the nation. That helps owners of homes, farms, and timberland but creates a revenue deficit, leaving state and local governments with less to spend to provide government services such as education, health, and public safety.

• Alabama’s state and local sales tax rates are among the highest in the U.S., which compensate for low property taxes.

• Alabama’s income tax does not provide the balancing effect that income taxes in other states do. Low-income workers begin paying taxes at a lower threshold than any other state. At the other end of the spectrum, Alabama is the only state that allows a full deduction for federal income taxes paid, a tax break that benefits high-income earners.

Despite unusual circumstances, Alabama’s rankings in per capita state and local tax collections were generally consistent with rankings in prior years.

Motor fuel collections per capita jumped in rank because half of Alabama’s fiscal year was pre-pandemic at a time when the economy was booming and gas prices high. In contrast, most states’ fiscal years began in the months after the pandemic began. Gas prices plummeted, and the total miles traveled on American roads didn’t recover until the calendar year 2022.

Alabama’s sales and gross receipts were also elevated thanks to the state’s high sales tax rate, the elevated volume of pandemic-related buying, and the economic stimulus payments that accelerated spending beginning in April 2020.

Despite all that, Alabama continues to lag behind almost all other states in total per capita collections.

Table 1. Alabama Rank in Per Capita Tax Collections, 2019, 2020, 2021.

In the years since FY 2021, tax revenues have surged based on the infusion of federal stimulus, low unemployment, and high inflation. Legislators have responded by making needed investments, particularly in education, in the form of teacher pay raises and a surge of additional support for literacy and math instruction.

At the same time, the Legislature has also passed tax cuts. In 2022, it increased the standard deduction for low-income Alabamians, allowing more households to shield more of their earned income from the income tax. In 2023, the state sales tax on food items was reduced from 4% to 3%, with a further 1% reduction scheduled for 2024 if revenue targets are met. These targeted tax cuts are a fitting response at a time when inflation is elevated, 3 with state tax collections surging to historic highs and federal COVID-19 relief funds swelling government accounts.

Flush times could allow Alabama to address years of chronic underinvestment compared to other states. Unacceptable conditions, such as understaffed and crumbling prisons, persist. Investments in education that show positive results must be sustained. However, as growth slows and federal aid is exhausted, Alabama governments will likely return to a familiar position of having less money to spend and yet a greater need for government services.

PARCA’s interactive charts allow you to explore a variety of statistics regarding Alabama’s taxes and tax revenue in comparison to other states. For the entire analysis, see our complete report in a printable version. Or read an embedded copy of the report below.


Alabama State Tax Collections, 2023

Increases, Decreases, and Trends in the Revenue Supporting State Government

The 2023 fiscal year, which ended on September 30, was a mixed year for Alabama revenue collections.

After several years of strong growth, Alabama tax collections turned in a mixed performance in 2023, with the General Fund (GF), which supports non-education spending, up substantially. Education Trust Fund (ETF) revenues, meanwhile, were basically flat after increasing by record levels in 2022.

GF collections increased 16.6%, led by a steep rise in revenue from interest on state deposits. The ETF barely budged, up 0.11%, with sales tax revenue increasing but income tax revenue down. That’s according to reports released last month by the state.

PARCA’s interactive charts allow you to explore trends in the various revenue sources that support the operations of state government in Alabama. For a detailed review of FY 2023 collections, see our complete report in a printable version. Or read an embedded copy of the report below.


Changes to the State Standardized Test and its Scoring

The Alabama State Board of Education voted on Thursday to change the test score students must earn to be considered reading on grade level by the end of third grade. The change was recommended by testing experts due to changes made in the content of the 2023 test and shifts in results.

Using the score the state had in place, 24% percent of third graders who took the state standardized test in the spring of 2023 would have scored below the grade level reading mark. Using the target adopted by the board on Thursday, 17% of those students would have scored below grade level.

The grade-level reading target will take on increased importance this spring when the retention provision of the Alabama Literacy Act takes effect. At that point, students testing below grade level by the end of third grade could be held back. (Students will have a chance to get up to grade level during an intensive summer literacy camp. Other exemptions and methods of evaluation are also available).

The second and third-grade reading cut score changes received the most attention because of the implications. However, the changes to the state standardized tests of English Language Arts (ELA) were made across all grades in 2023. Along with changes in test content, the test scale was shifted, and proficiency cut scores adjusted. The changes make performance comparisons and trends across years difficult to interpret.

The Alabama Comprehensive Assessment Program (ACAP) is a series of standardized tests specifically built for Alabama, designed to test students at each grade level as they progress through the Alabama’s courses of study in English Language Arts, Math, and Science.

The original ACAP reflected the course of study in place in 2020. However, in 2021, the state adopted a revised ELA course of study. That revised course of study included a heightened focus on reading skills as called for by the Alabama Literacy Act. Changes to the course of study included:

  • phonemic awareness and fluency added in grades 2-3;
  • phonics added in grades 2-5
  • listening skills added in grades 2-8
  • text-dependent writing added to grades 2-3
  • Recognizing and producing writing in different modes: narrative, informational, and opinion writing added in grades 2-8

Thus, with new concepts and points of emphasis added to the test, the test results were re-examined in light of the changes. Cut scores for the four achievement levels were adjusted. As a result, the test score a student needed to be considered proficient, i.e. scoring at either level 3 or level 4, was changed.

Comparing 2023 and 2022 results, average numeric scores in 2023 were lower in every grade but 6th. However, since the tests were changed and the scales were changed, the state department recommends against comparing scores from year to year.

While mean scores were down, proficiency rates were generally up. The percentage of students earning a score in the proficient range increased in all grades except third and eighth, where proficiency declined by 1% and 3%, respectively. The biggest jump in proficiency was in fifth grade, where the percentage of students scoring proficient jumped 9 percentage points. That is despite a large decline in the numeric mean score in 5th grade.

Because the tested material changed and the test scale was shifted, it is difficult to say if the score changes and proficiency changes were due to changes in student performance, changes in the scoring, or a combination of those and other factors.

Three of eight State Board of Education members voted against lowering the cut score that determines which students are reading below grade level. Those members expressed concern that students who weren’t prepared for the next academic level would be promoted and find themselves far behind and without the literacy support available in the early grades.

However, the majority of board members expressed support for following the advice of testing experts, recognizing that students this year were essentially taking a new test that required a new evaluation of results. Even with the lower cut scores, education officials are expecting a sharp increase in the number of students being required to repeat third grade in order to catch up in reading.

About half the states have some sort of retention provision. Alabama’s approach is modeled after Florida and Mississippi efforts. Both those states have seen large gains in reading on national assessment after implementing a systematic approach to literacy instruction.

Like those states, Alabama has dramatically increased funding and professional development for reading instruction and has especially targeted schools and systems with high concentrations of struggling readers.


Alabama Standardized Test Scores Rise in 2023

Alabama public school students improved their performance on statewide standardized tests in 2023, with the percentage of students testing proficient rising across most of the tested grades (3-8) and subjects (English Language Arts (ELA), math, and science).

Printable PDF version available here.

Figure 1. Trends in Proficiency by Subject

Just over half of Alabama students, 52%, were proficient in English Language Arts across all grades, and only 31% demonstrated grade-level proficiency in math. Fourth and eighth graders were tested in science, with 41% scoring proficient.

Figure 2. Trends by Subject and Grade Level

English Language Arts

The broad-based improvement comes as a relief since earlier this summer, a subset of the test, 3rd-grade reading results, showed a decline in the percentage of students reading on grade level. Those third graders also showed a slight decline on the broader test of English Language Arts, with the percentage of students proficient declining from 54% to 53%. Eighth graders’ ELA proficiency rates declined by almost 3%, to 50%. However, for students in grades 4-7, the percentage of students scoring proficient in ELA improved. The 2023 ELA test was adjusted to reflect updates to the ELA course of study. It is unclear how those changes might have impacted scores.

But across all grades in English Language Arts, a curious pattern is present. The percentage of students scoring at the highest level of proficiency is growing but the percentage of students scoring at the lowest level of proficiency is also growing.

The test groups students into four levels:

  • Level 1: Minimal understanding of grade-level standards
  • Level 2: Partial understanding of grade-level standards
  • Level 3 Strong understanding of grade-level standards
  • Level 4: Advanced understanding of grade-level standards

Figure 3. ELA Results, by Percentage of Students at Each Level of Proficiency

Across all grades on the ELA test, more students are testing at Level 4, while at the same time, more students are scoring at Level 1, the lowest level.

Math

The math results are different. Math proficiency has long been Alabama’s Achilles heel, with our students scoring consistently at or near the bottom on national tests. While proficiency is still low overall, math results on the ACAP are improving. As in ELA, more students are testing at Level 4 in math. But unlike ELA, the percentage of students scoring at the lowest level is also shrinking.

Figure 4. Math Results, by Percentage of Students at Each Level of Proficiency

In math, students in every grade improved their proficiency rates. However, another long-running problem for Alabama’s math proficiency is that it declines steeply as children move into middle school. In 3rd grade, 44% of students are proficient, but by 8th grade, only 21% are.

The Challenge of Poverty

One constant about standardized test scores is that the socioeconomic composition of a school correlates with performance on standardized tests like the ACAP. In schools and systems where rates of economic disadvantage are low, a higher percentage of students achieve proficiency. Schools and systems where economic disadvantage is concentrated, standardized test performance is lower.

Figure 5 allows the presentation of both factors at the school system level. Systems in dark red and on the left of the chart have higher concentrations of economic disadvantage. Systems that are dark green are on the right side of the chart. Systems high on the chart have high rates of student proficiency. Systems lower on the chart have lower rates of proficiency. The line slopes up and to the right to reveal the pattern in the data: a lower percentage of students in poverty, the higher the percentage of students achieving proficiency.

Figure 5. Percent of Economically Disadvantaged Students vs. Proficiency Percentage

A similar array, but looking at performance at the school level, is also available. While this pattern recurs across datasets, these charts highlight the fact that some schools with high levels of economic disadvantage outperform peer schools with similar levels of poverty.

Another encouraging note is that the widespread improvement observed in the results, across grades and subjects, was not restricted to one race or ethnicity, or to a socioeconomic subgroup. Performance gaps between groups remain. But almost all economic and demographic subgroups improved their overall rates of proficiency in the three subjects. In both 4th and 8th grade, the declines in English Language Arts proficiency declines were also distributed across all subgroups.  

Figure 6. Trends among Student Subgroups

Alabama students and faculty continue to recover from time and learning lost during the Covid 19 pandemic. Results indicate that teachers are becoming more successful at teaching learning standards, and students are mastering those standards at higher rates. On all fronts, Alabama has a long way to go if it is going to provide a nationally competitive education. Proficiency in math is a long-running concern; in nearly 20 districts, 10% or less of students are scoring proficient. In English Language Arts, the rising percentage of students scoring at the highest level is a cause for celebration. However, the growing number of students scoring at the lowest level is a particular concern as Alabama emphasizes literacy.

Record education budgets, supplemented by pandemic-related federal aid, have allowed for higher levels of education spending than ever. The Legislature has invested in more systematic approaches to literacy and math instruction. It is imperative that schools, systems, the state, the Legislature, the Governor, and the general public identify money being spent that is producing positive results. Successful approaches should be maintained when the inevitable constriction of revenue arrives. Ineffective spending should also be identified and reprogrammed.


New Reading Scores Released As Schools Head Toward Full Literacy Act Implementation

About one-quarter of Alabama third graders were not reading on grade level by the end of third grade, leaving them vulnerable to academic struggles as they progress in school, according to data from the reading subsection of the Alabama Comprehensive Assessment Program released Thursday.

Printable PDF version available here.

Among second graders, 11,622 or 22% of students statewide were below grade level at the end of second grade. Parents and educators have a year to get those struggling readers caught up to grade level. Next year, the final piece of the Literacy Act is set to go into effect. Third graders who haven’t caught up to grade level by next spring could be vulnerable to being held back.

Since the Literacy Act was passed in 2019, the State Legislature has provided major increases in funding for reading instruction and services, re-energizing the Alabama Reading Initiative (ARI) and school-based reading coaches. Teachers from Kindergarten to third grade across the state have received intensive professional development designed to improve the teaching of reading, an instructional approach based in the science of reading.

ARI has deployed extra support to high-needs schools. Alabama’s Literacy Act was based on similar legislation in Mississippi and Florida. Both those states have seen significant gains in early grades literacy after implementing reforms.

This year, 24% of Alabama third graders tested below grade level. That’s up from 22% in 2022. State Education officials pointed out that the 2023 test was updated to reflect the state’s new course of study and differed from the 2022 test. (See information from the Department). Also, this year’s third graders were in kindergarten when schools closed in Spring of 2020 due to the Covid-19 pandemic. Their first-grade year was, in many cases, disrupted by continuing complications of the pandemic, including remote learning during a critical period for their reading instruction.

Not all students reading below grade level would be retained under the act. The Literacy Act contains good cause exceptions for students who are receiving services for diagnosed learning disabilities. The Act also provides alternative methods of measuring a child’s literacy level. However, the goal of the Act is to encourage parents and schools to identify struggling readers early and provide needed interventions, so they are ready for the educational pivot that occurs in fourth grade.

Alabama Reading Initiative Director Bonnie Short told State Board of Education members Thursday that initial analysis indicates systems where more teachers were trained in and fully implemented the research-based approaches to instruction gains in reading performance were higher.

By fourth grade, students are expected to know how to read and to use reading to learn. According to research:

  • A child not reading proficiently by the end of 3rd grade is four times more likely to fail to graduate from high school. Among students who failed to complete high school, 2/3 were not reading on grade level by the end of third grade.
  • A struggling reader who is also poor is three times more likely to fail to graduate than a struggling reader who isn’t living in poverty.
    • Source: Jeopardy: How Third Grade Reading Skills and Poverty Influence High School Graduation

All students from kindergarten through third grade who aren’t reading at grade level are provided literacy boot camps in the summer. In high-need schools, all students are offered the opportunity. According to Alabama State Superintendent Eric Mackey, about half the students who take advantage of the summer program test at grade level by the end of the summer. However, not all of the identified children attend the summer literacy programs, as they are not required to. The state department and school systems are trying to encourage attendance and remove barriers. This summer, the state has authorized the use of transportation support for the literacy camps.

The highest concentration of students testing below grade level tend to be found in school systems where the poverty level is highest. The graphic below shows that correlation.

But demographics are not destiny. At the school level, there is a wide variation in the percentage of students reading below grade level. Thus, school-based leadership, teaching, training, culture, and resources make a difference.

You can explore your local system and compare results to peer systems, systems with similar economics and demographics.

Results are also available at the school level.