Before the Coronavirus pandemic, economic developers in Southeast Alabama recognized the advantages of pulling together as a region rather than each city and county trying to recruit new industry independently. Wanting to take cooperation to a new level, they asked PARCA to investigate how other regional economic development organizations across the state and across the nation work.
When the pandemic struck, cooperation shifted into overdrive, and more counties rallied to the cause.
“We really pulled together as a region. We shared information about challenges and opportunities in the face of the crisis, and we strengthened our relationships,” said Veronica Crock, president of the Ozark-Dale County Economic Development Corporation. “As we come out of the pandemic, we will all benefit from working together to retain our existing businesses in a time of such uncertainty, and we will benefit from working together as a team to bring new jobs and industry to our region.”
PARCA’s newly released report, Growing Cooperation in Southeast Alabama, describes the efforts of the 11 counties in the state’s Wiregrass region to turn their loose alliance into a sustainable regional organization. Together, the counties hope to broaden their appeal, extend their reach, and amplify their message, while decreasing duplication of effort and expense.
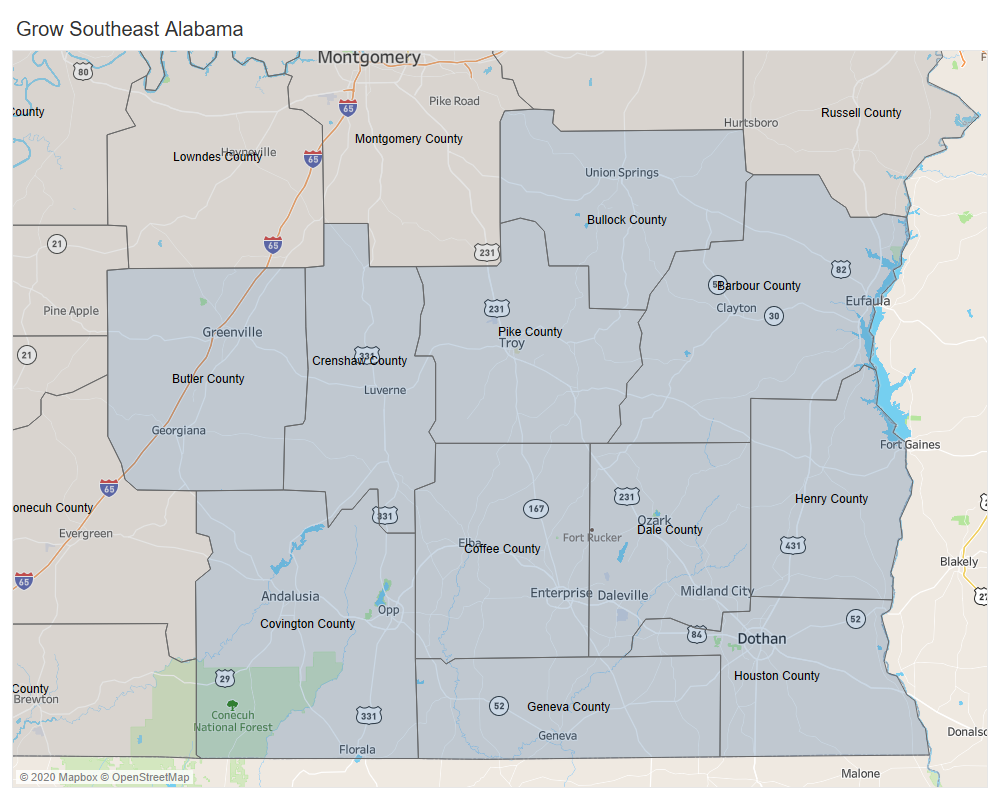
Grow Southeast Alabama consists of economic development entities in Houston, Henry, Butler, Crenshaw, Coffee, Covington, Dale, Barbour, Bullock, Geneva, and Pike counties. Most off the Interstate corridors that connect the state’s largest metros, the counties in the Southeast corner of Alabama sometimes feel overlooked and undervalued. While known for peanut farming and pine forests, the region’s strength as a hub of aerospace and defense contractors is under-appreciated. Dothan, the region’s center of gravity, is the state’s seventh-largest city and is ringed by smaller but still considerable population centers, Enterprise and Ozark. Dothan is growing and serves as a trade and healthcare hub for a wide radius of counties in Alabama, Georgia, and Florida.
Though the counties are united under the state’s regional workforce council system, they are spread and don’t have a long history of working together. While that’s not uncommon, some portions of the state have a head start on building economic coordination and regional identity across county lines. For instance, North Alabama counties have been working together for decades through the North Alabama Industrial Development Association and the Alabama Mountain Lakes Tourist Association. There is no set pattern for how the various roles in economic development and workforce development are organized and carried out at the regional level. Sometimes a regional chamber of commerce, like the Birmingham Business Alliance or the West Alabama Chamber of Commerce, may play an overarching role. And meanwhile, a locally-funded economic development organization engages in more targeted recruitment and support for existing industries.
The developers involved in Grow Southeast are sorting out which functions will be carried out by a regional organization and which will remain local. A central challenge will be sustainably financing the regional organization while preserving funding for the local economic development organizations and programs. Another will be setting up rules and expectations for working together for the region while, at times, competing on behalf of their local community.
“We greatly enjoyed working with the PARCA team and are grateful for the professional, thorough, and detailed report they provided,” Crock said. “Their research was not only instrumental in bringing to light the positive and negative aspects of working collaboratively in a competitive environment, but also confirmed our commitment to putting this competitiveness aside for the sake of the region.”
“We benefitted from the research into the framework of successful economic development in other regions in the United States,” she said. “We will certainly rely on this report as we position ourselves to move forward in our regional collaboration effort.”
How Alabama Taxes Compare, 2020 Edition
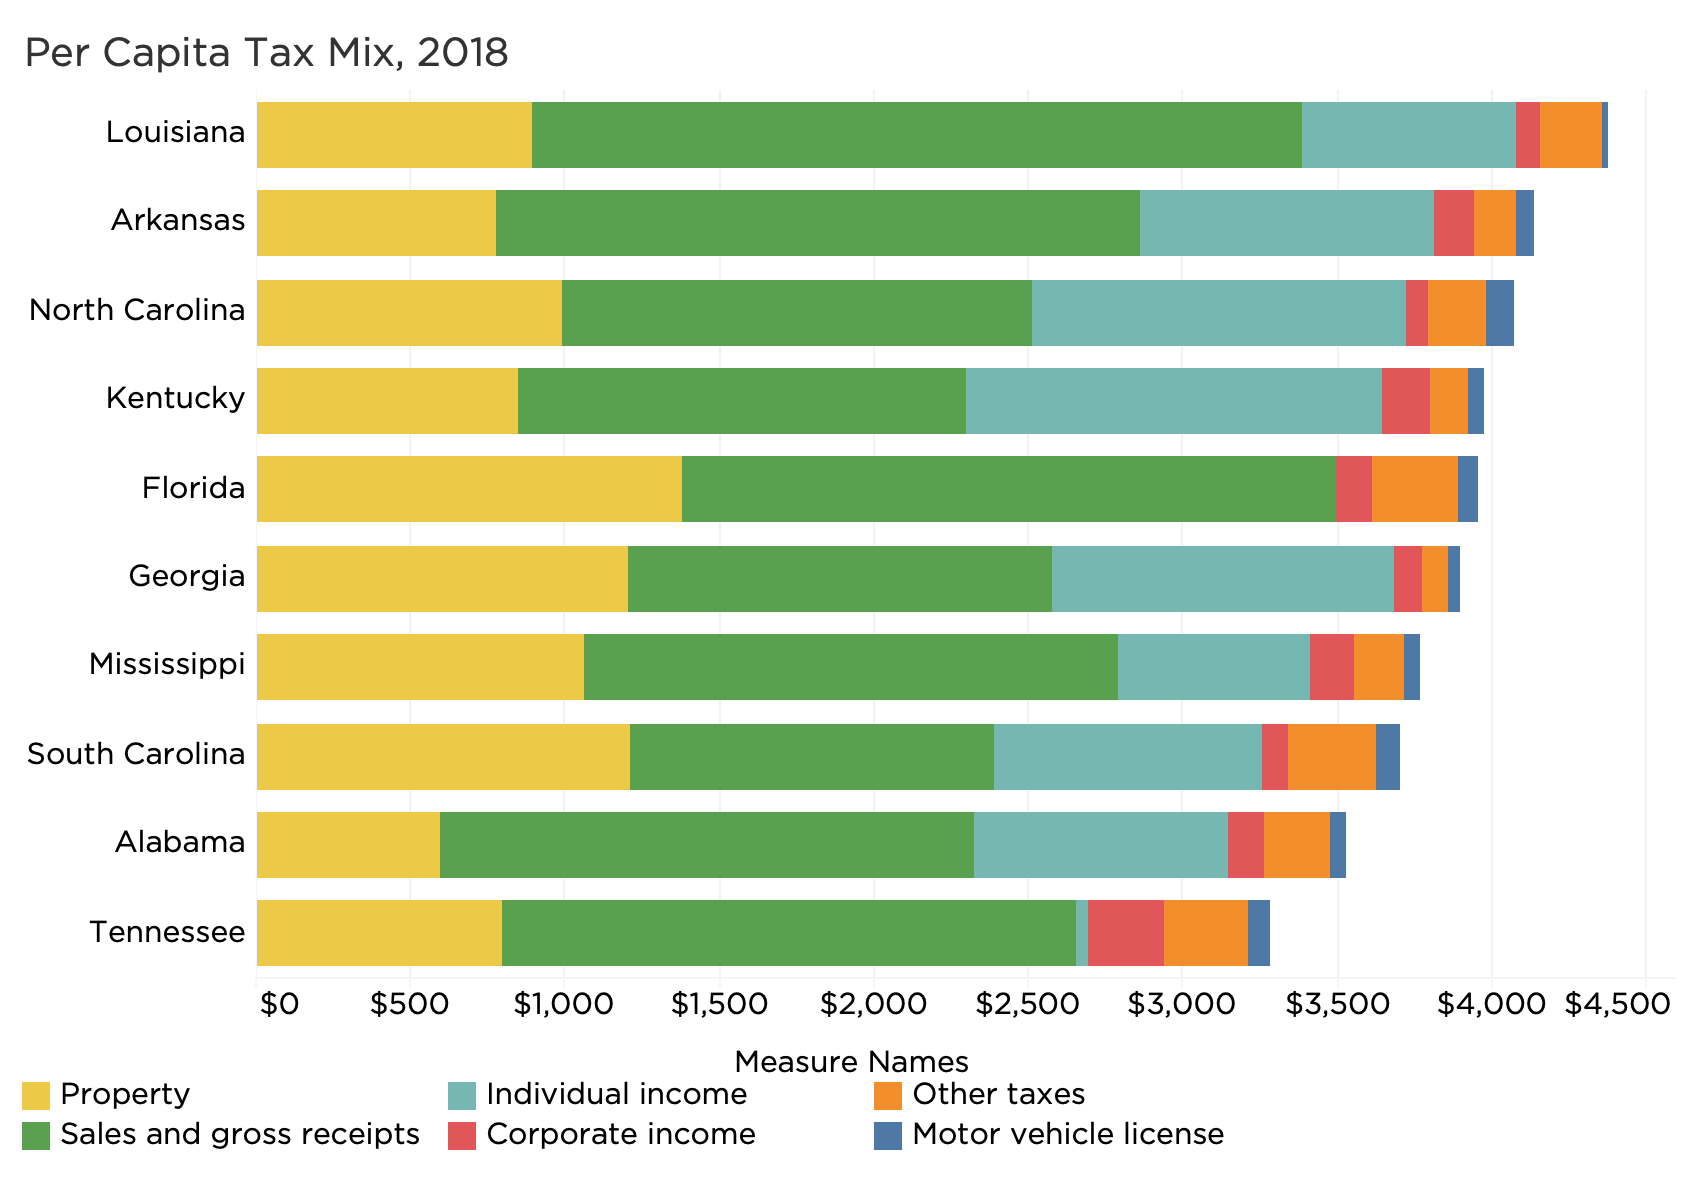
Alabama had the nation’s second-lowest tax collections per capita in 2018, the first time since the 1990s that any other state — in this case Tennessee — had lower state and local tax revenue per resident than Alabama.
Economic growth in Alabama, including a significant gain in income tax collections, helped Alabama nudge past Tennessee. It also helped that Tennessee is in the process of phasing out what remains of its small income tax and also reduced its sales tax rate on groceries. Tennessee’s more rapid population growth may also have had some effect on the per capita calculations.
Despite outpacing Tennessee, Alabama still trails far behind other Southeastern states in the amount of state and local taxes collected per resident, which partially explains why Alabama struggles to provide the same level of public services as other states.
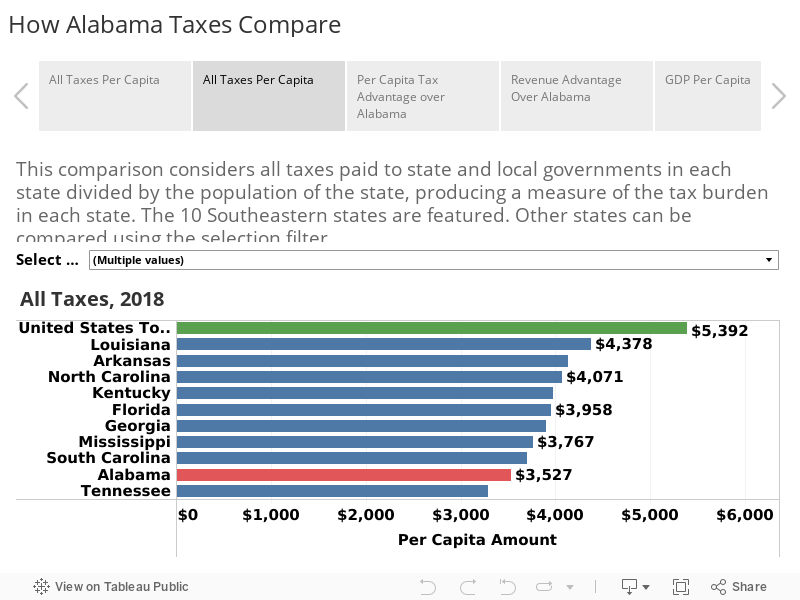
PARCA’s 2020 edition of How Alabama Taxes Compare describes Alabama’s tax system and how it compares with tax systems in other states, based on the latest data available from the U.S. Census Bureau and the Bureau of Economic Analysis.
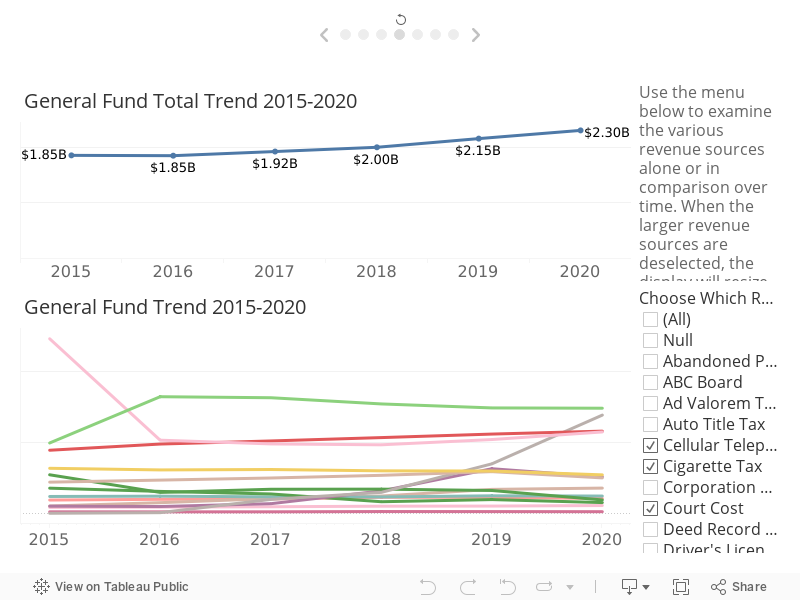
In addition to the PDF version of the report, the interactive charts below allow you to explore the data on your own. For better viewing, expand to the full-screen view by clicking on the button on the bottom right of the display below. Navigate through the story of Alabama taxes using the tabs at the top of the interactive display.
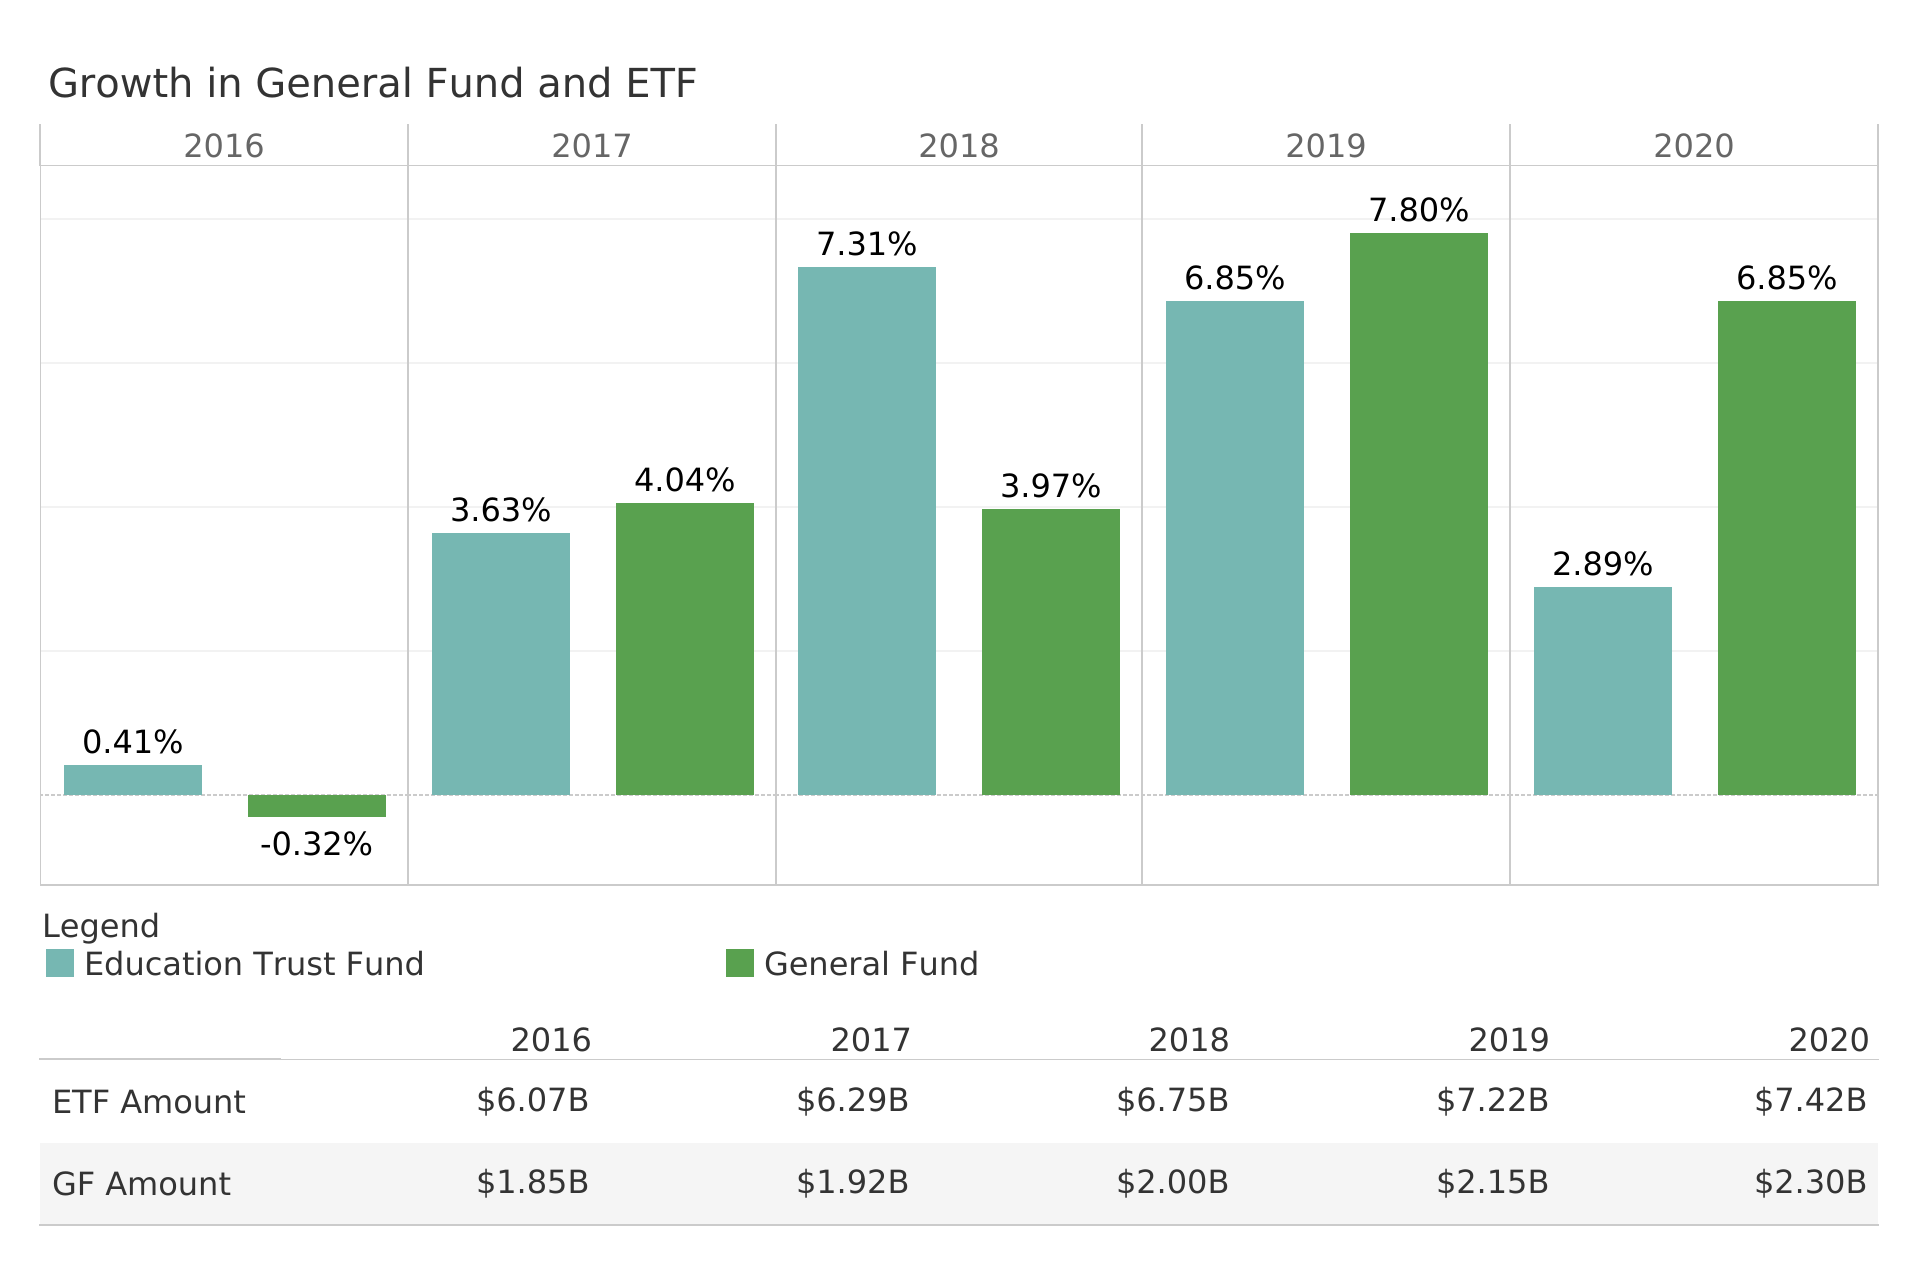
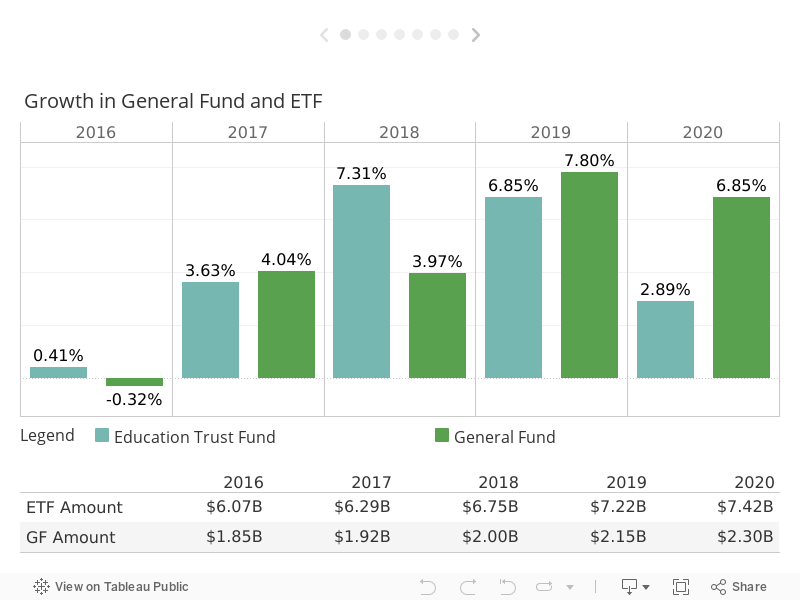
Tax revenue flowing into Alabama’s General Fund and Education Trust Fund held up surprisingly well in 2020 fiscal year in spite of the Coronavirus pandemic, thanks to an extremely strong state economy preceding the pandemic and a flood of federal aid that followed the pandemic’s arrival.
Remarkably, both Alabama’s General Fund and its ETF grew substantially in 2020, meeting and exceeding budget expectations. The ETF took in an additional $209 million in 2020 compared to 2019, a 3% increase. The General Fund received 7% or $147 million more in 2020 than it did in 2019.
How is that possible considering the spike in unemployment that began in March and still has not completely abated? What about the mandatory business closures in March and April and the restrictions still in place to protect against the spread of the Coronavirus?
Several factors combined to dampen the blow to tax revenues.
A very strong economy going into the pandemic. Unemployment was at a historic low between October and March. That makes up the first half of the fiscal year. Prior to the pandemic, income tax receipts were up around 7% over the same period in 2019. Collections dropped drastically but then began to recover. Taking the whole year into consideration, income tax collections were up 2.4%.
Unprecedented levels of federal aid to businesses and individuals. into the economy. According to USASpending.gov, individuals and governments in Alabama have received commitments of $4.1 billion in grants, loans, director payments, or contracts related to Covid-19 relief.
Sustained consumer spending. With the Paycheck Protection Program preserving payrolls, and unemployed workers receiving $600 per week in a supplement to unemployment insurance, spending shifted but didn’t contract to the extent it could have. Sales taxes dropped, then recovered and have been up and down in the months since. At the same time though, tax on internet purchases surged, offsetting the erosion in sales tax. Unlike some other states, Alabama’s sales taxes apply to groceries and medicine and thus it tends to be more stable.
Thus far, a relatively quick recovery. By August, Alabama’s unemployment rate was 5.6%, down from 13.8% in April. That’s better than the national rate of 8.4%. September 2020 results on income and sales taxes trailed September 2019 results but not dramatically.
The overall stability of the budget masks some major shifts in some revenue sources. Some of the changes were pandemic related, some not. Here are some highlights.
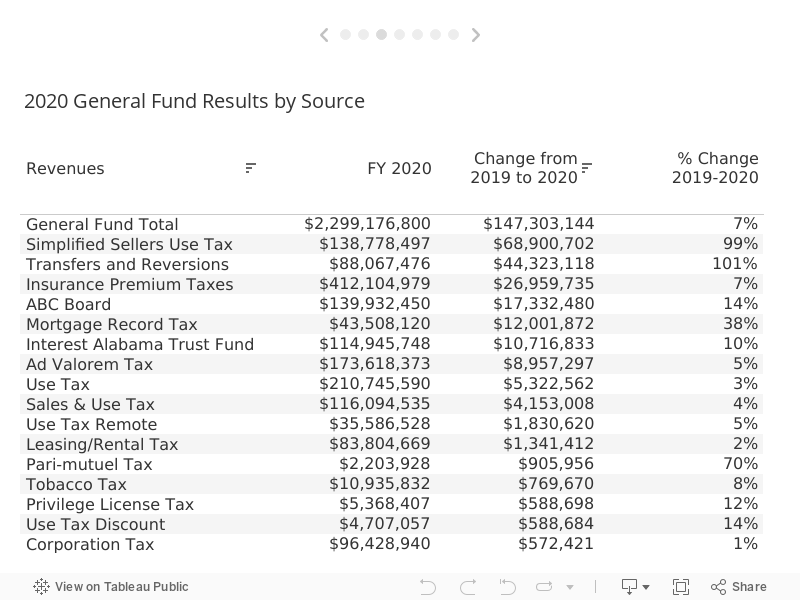
General Fund Revenue Sources
The General Fund is supported by a myriad of tax sources. Traditionally, most of those sources saw little in growth from year to year, and the General Fund struggled to keep up with rising expenses in non-education expenses.
However, in recent years, some growth taxes have been added to the General Fund and support for general fund agencies has become more stable.
Big gainers
Simplified Sellers Use Tax: Revenue from this tax on online sales nearly doubled, up $69 million to $139 million. There are two reasons. First, this is a relatively new tax, and some new retailers joined the program for the first time. So, prior to the pandemic, the tax was already up significantly. When the pandemic set in, people shifted more spending to online purchases. While this tax, a portion of which also goes to the ETF, is expected to continue to grow, it is not expected to grow at nearly this rate in the future.
Transfers and Reversions: This boost of $44 million to the General Fund was inflated by a transfer from the Revenue Department. The department transferred $22 million in fees related to drivers who didn’t have Mandatory Auto Liability Insurance.
Insurance Premium Taxes: An additional $27 million flowed in from this tax on insurance premiums. This can be the result of more policies issued or a rise in the cost of insurance. This is the largest source of revenue in the General Fund contributing $412 million in 2020.
ABC Board: With bars closed and people stuck at home, Alabamians apparently flocked to liquor stores contributing an extra $17 million to the General Fund, an increase of 14%. Most of the jump occurred in April and May, which were record months for the ABC board.
Mortgage Record Tax: An additional $12 million flowed into the General Fund from this percentage tax charged on both refinances and home purchases. Revenues from this source accelerated in the June, July, August, and September as interest rates plunged and refinancing surged. For the year, the tax was up 38% over 2019.
Interest on the Alabama Trust Fund: A 10% jump came from the proceeds off the investments in the State’s savings account, the Alabama Trust Fund. The savings account is back at full strength now since Alabama repaid its previous borrowing from the fund that occurred during the Great Recession. That and a strong stock market helped it generate $11 million more in 2020 than it did in 2019.
Big losers
Oil and Gas Production Tax: Thanks to the collapse in the oil market, this tax dropped by $13 million, down 41% from 2019.
Interest on State Deposits: The state earns interest on the cash it holds but because of dropping interest rates this source of revenue declined $11 million or 18%.
Lodging Tax: This tax on hotels and vacation rentals was down 15% for the year, collecting almost $9 million less for the General Fund. According to Finance officials, the drop would have been even more precipitous, but the Gulf Coast beaches saw a surge of business during the summer. The continued depression of convention and hotel traffic will continue to weigh on this revenue source, which is important for cities and for the state tourism agency. Hurricane Sally will also take a toll.
Court Costs: With the courts closed or severely limited in operation, the costs assessed to participants in the court system dropped by $5.4 million or 9%.
Education Trust Fund
The ETF supports K-12 schools and colleges and Universities. Flowing into it are the state’s two largest revenue sources: the income tax and the sales tax.
Big Gainers
Benefiting from growth taxes, the ETF has traditionally seen the strongest ups and downs: rapid growth in good times and jarring contractions when the economy falters. However, more recently the Legislature has spread some of the growth taxes and has imposed rules on how fast spending can grow. These restraints have thus far prevented mid-year budget cuts and have allowed the accumulation of reserve funds.
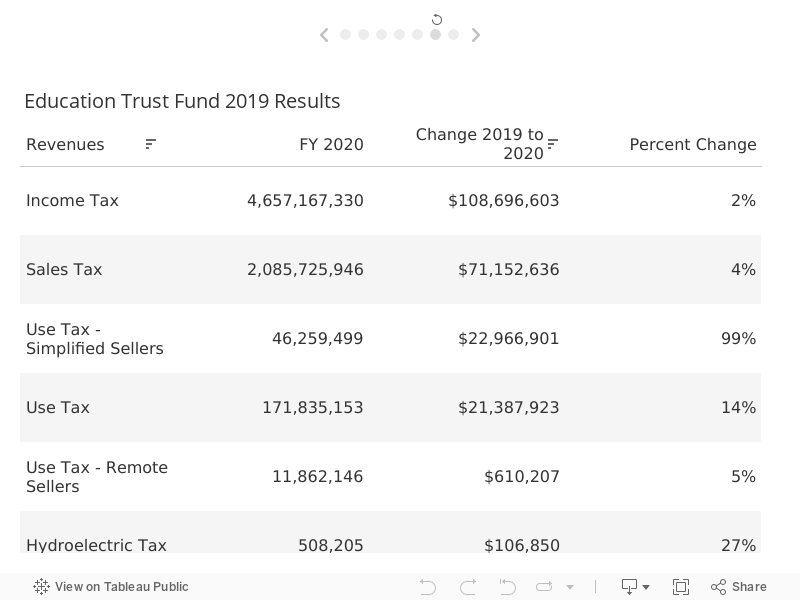
Income Tax: Income tax receipts to the Education Trust Fund totaled almost $4.7 billion in 2020, $109 million more than 2019, an increase of 2%. Pre-pandemic this tax was trending toward an astounding 7% increase.
Sales Taxes: The state received over $2 billion in sales tax revenue in 2020, $71 million more than last year was sent to the General Fund. In actuality, sales tax revenue increased 2.25%, solid growth, that didn’t fall off significantly during the pandemic. Smaller retailers did suffer during the closures, but grocery and hardware stores saw strong sales. With the enhancement unemployment compensation ended and continued uncertainty in the labor market, budget forecasters are keeping a close eye on this revenue source. However, so far, spending levels have held up. Revenues from September 2020 were 2.9% higher than in September 2019.
Simplified Sellers Use Tax: As in the General Fund, the contribution of this tax nearly doubled, bringing in an additional $23 million to the ETF. The proceeds of the tax are divided, with the ETF receiving 25% and the General Fund 75%.
Use Tax: A 14% increase in the Use Tax is not all because of growth. More than half the “increase” stems from the fact that the state had to pay a $12 million refund out of this tax source last year.
Biggest losers:
The Utility Tax: Down 3% or $13 million, this tax was lower because of lower energy use thanks to a cooler summer.
Mobile Telecom Tax: A dying tax, this tax applied to phone plans that sold talk time. For the most part, cellular plans now provide unlimited talk time at no charge but charge for data, which is not covered by this tax. Revenue continues to decline, down another $2 million or 18% lower than last year.
From the Year’s End Looking Forward
According to Finance Department officials, Alabama ended 2020 with $330 million balance in the ETF and a $315 million balance in the General Fund. That was result both of revenues that exceeded the budgeted amounts and expenditures that were lower than what was appropriated.
For the current fiscal year, FY 2021, Finance officials are relatively confident that revenues will more than cover the budgets. Lawmaker scaled back spending plans in light of the pandemic. As long as there aren’t additional unforeseen shocks to the economic system, the Alabama economy should generate the revenue needed to make the budgets as adopted this spring.
ETF
ETF 2020 budgeted: 7,125,895,252
ETF 2020 Receipts: 7,423,906,758.89
ETF 2021 budgeted 7,217,422,487
General Fund
General Fund 2020 budgeted: 2,192,379,876
General Fund 2020 receipts: 2,299,176,800
General Fund 2021 budgeted; 2,393,272,863
And if things were to falter, Alabama still has reserves to tap under extreme circumstances. Rainy Day Funds for both budgets have been repaid and additional budget stabilization funds are also available. As of now, none of those emergency measures have been employed.
RESERVE FUND BALANCES
ETF Budget Stabilization Fund – $373,269,077
ETF Rainy Day Account – $465,421,670
GF Budget Stabilization Fund – $27,297,483
GF Budget Rainy Day Account – $232,939,781
Raising Educational Attainment by Keeping College Graduates
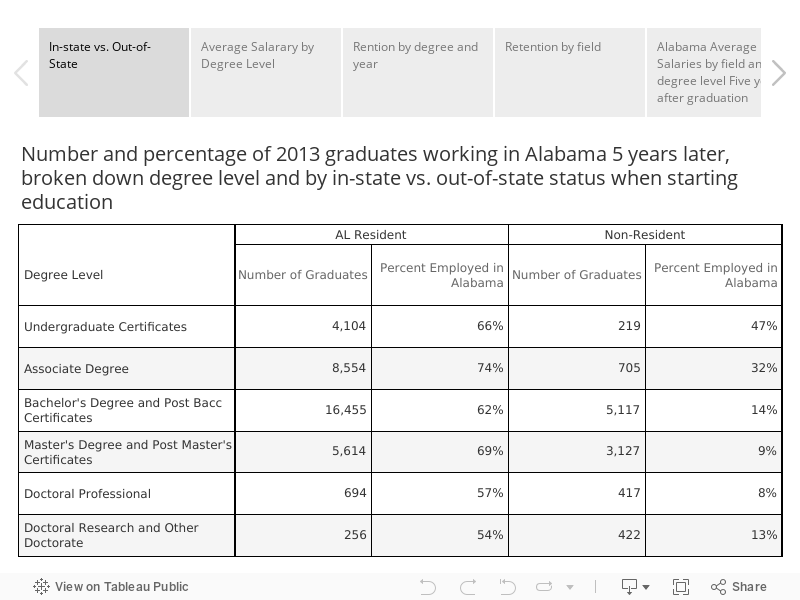
The study, which compared graduation records to labor force data, found that 62% of in-state students who earned a degree were in the state’s labor force after five years, but only 14% of the out-of-state students who earned bachelor’s degrees from Alabama institutions continued to work in the state.
Keeping more college graduates in Alabama is vital. Increasing the number of highly trained and educated individuals in Alabama is a cornerstone goal of Success Plus, the workforce improvement initiative championed by the Governor’s Office and state business and education groups. So far, most of the attention in that initiative has gone toward enhancing connections between education and business and aligning education and skills offerings with the needs of students and Alabama’s employers. Those efforts may help keep graduates, but more direct retention efforts appear to be warranted.
Education Powers the Economy
The state’s overall economic and social prosperity is strongly tied to its raising levels of educational attainment. Earning power and labor force participation rates are closely linked with educational attainment, a fact the ACHE study reinforces. As a recent PARCA analysis shows, states with higher levels of education, particularly bachelor’s degree attainment, have higher income levels and better health outcomes. Alabama has historically lagged behind other states’ residents with a high school degree but is now close to the U.S. average. However, when it comes to college education, the gap remains, and may be widening.
Post-high school training and education is required in most of the job fields where employment growth is occurring. Companies looking for highly skilled workers tend to locate and expand in areas where those graduates are concentrating. That drives job creation which then draws applicants, creating a feedback loop.
This cycle can be seen within Alabama with metro cities and counties drawing an increasing share of the highly educated population. And it can be seen nationally, as the percentage of population with a college education grows faster in other states than it is grows in Alabama. The ACHE study shows one reason why: Alabama is exporting its higher education graduates.
ACHE’s study used institutional data from Alabama two-year and four-year schools to identify graduates and then looked for those graduates one year and five years later in Alabama Department of Labor data drawn from the unemployment compensation system.
The study would not capture graduates who are self-employed or who are not in the workforce but are still living in Alabama. And it does not provide information on where graduates may have moved.
Still, ACHE’s analysis is an innovative collaboration between state agencies, a collaboration that previews the insights that can be gleaned from a privacy-protected, linked system of government databases.
Rate at which graduates are working in the state five years after graduation
In-state employment rate by degree field and degree level
Earnings by field and degree level from community college-awarded certificates up to doctoral degree.
National Comparisons
Since this is data specific to Alabama graduates and Alabama workers, ACHE can’t provide a matching dataset from other states to determine whether Alabama’s retention of graduates is higher or lower than other states.
However, studies based on other data also indicate that Alabama is a net exporter of college graduates and is experiencing a brain drain.
A 2019 study by the Joint Economic Committee of the U.S. Congress used Census data to track patterns of migration between states of individuals with higher education credentials.[1] The data identified individuals born in one state who, as middle-aged adults, were living in another state. A group of states clustered along the East and West Coast are drawing a disproportionate share of people with higher levels of educational attainment. Texas, Colorado, and Illinois are also gaining college graduates. They also tend to be home to large cities and their suburbs. The report concludes that the overall pattern of migration has led to a sorting process, a divergence in economic growth, and a parallel divergence in political attitudes between the states.
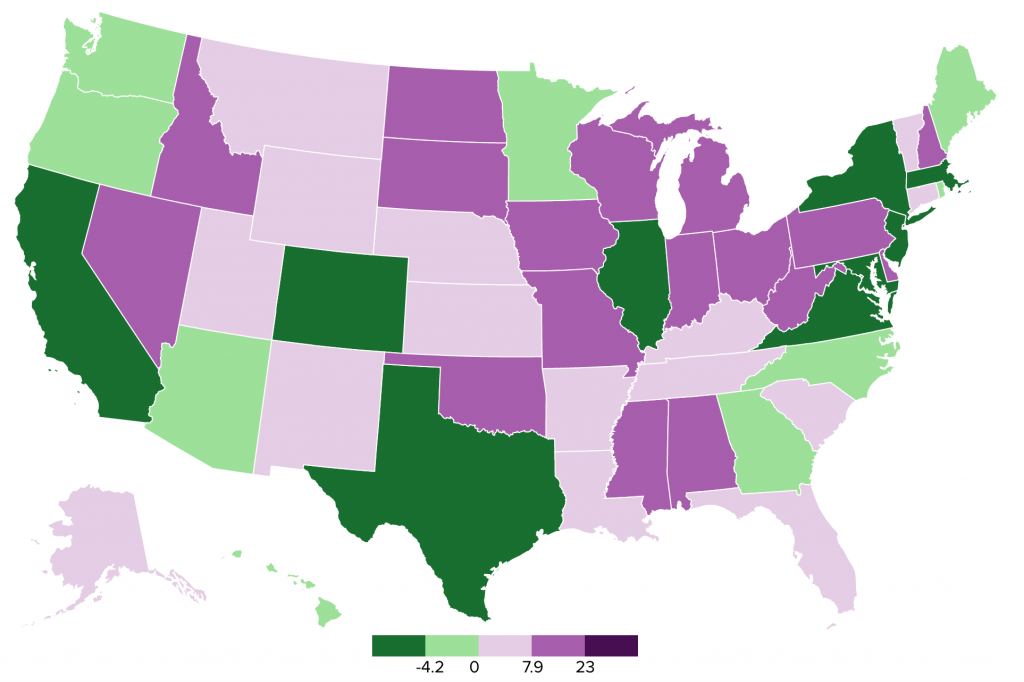
Figure 1. Net Brain Drain, 2017
The states in green are taking in more college graduates than they are sending away. The states in purple send more graduates out of state than they are bringing in.
This map displays each state’s “net brain drain.” Net brain drain calculates the number of highly educated people who stayed, minus those who left, plus the new highly educated “entrants” who come from other states. Accounting for those flows, Alabama and Mississippi were experiencing brain drain, represented by a positive number. (Alabama has 8.8 percentage point Net Brain Drain; Mississippi’s was 13.5). By contrast, Georgia had a negative brain drain (-1.1), indicating they were actually experiencing a brain gain, drawing in more educated residents than they were losing.
The data from the report indicates that Alabama exports highly educated individuals primarily to other Southern states. Alabama exports the most graduates to Georgia, followed by Florida, Tennessee, Texas, and North Carolina.
Who do we keep?
Most people, 70%, who earned an associate degree in Alabama were working in Alabama five years later. Those earning certificates were slightly less likely to show up on Alabama work rolls five years later, with about 64% located.
For degrees above associate, the higher the degree the less likely that the individual could be found working in the state five years later. Those who earned doctoral research degrees at Alabama institutions are the least likely to be working in the state five years after earning their degree.
Looking under the surface, Alabama residents are much more likely to remain and work in the state compared to non-residents who come to Alabama to attend college.
About a quarter of those earning an undergraduate degree in Alabama originally came from out-of-state to attend college in Alabama. The University of Alabama has been particularly aggressive about recruiting out-of-students. So much so, that resident students now make up less than 40% of the student body. Auburn has a long tradition of attracting out-of-state students, particularly from Georgia, over 40%t of its student body is from out-of-state.
But five years after earning a degree in Alabama relatively few of those out of state students were found to be working in the state.
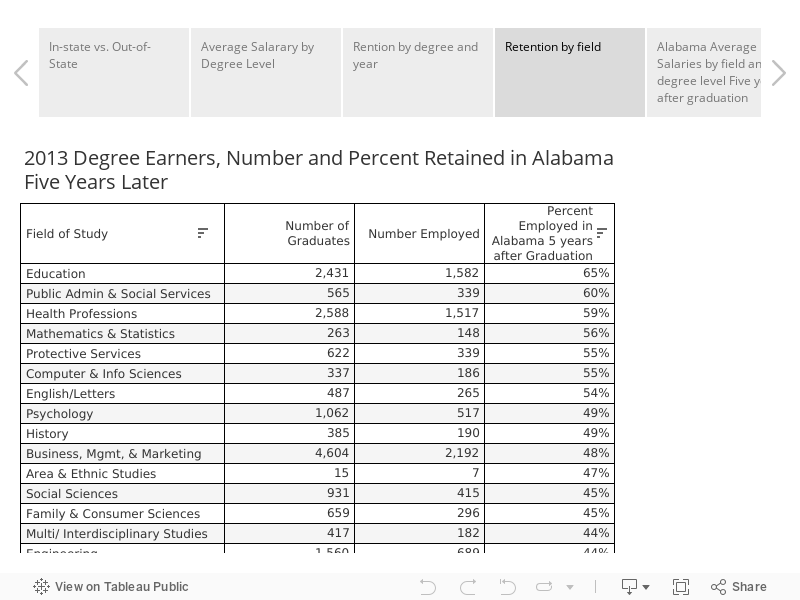
Graduates in education, health professions, engineering technologies, and social services were most likely to work in Alabama.
On the other hand, doctoral graduates and graduates in fields of study such as architecture, physical sciences, and communications were the least likely to be employed in the state after five years.
As Alabama attempts to raise educational attainment levels in the workforce, those out-of-state students would be a prime target for retention. At the same time, investments in the success of our in-state students are more likely to pay dividends since they are more likely to stay in the state.
Earnings by degree field
The ACHE study confirms national studies on the effect of education on income levels. In general, each step up the educational ladder yields a higher income. That differential further explains why raising educational attainment is advantageous for a state: the more highly educated residents in the state, the higher the total income.
Across the board, a person earning a doctoral degree in a field earns about 3 times more that someone who earned an associate degree in the same field.
This snapshot of earnings does not take into account the cost incurred by an individual who pursued higher education. Nor does it take into account the delay in starting a career while pursuing a degree. However, considering the long term pay off, the additional investment does, on average, produce rewards.
Still, the differential provided by a degree very much depends on which field the degree is in. For instance, associate degree holders in science technologies, construction trades, agriculture, and precision production were, on average, earning over $50,000 a year five years after graduation. On the other hand, bachelor’s degree holders in 23 fields identified in the ACHE study– area and ethnic studies, communications technologies, English, public administration, visual and performing arts, psychology, and foreign languages among them) average less than $50,000 a year after five years.
The highest average salaries among bachelor’s degree holders five years after graduation were among those with degrees in engineering ($74,191) and computer and information sciences ($65,792). Followed by engineering technologies ($59,796), health professions ($54,832), and business management and marketing $54,547).
Strategies for Retention
As a result of the Employment Outcomes report, ACHE has begun to implement initiatives designed to improve the retention of recent graduates. Such initiatives include increasing student engagement with Alabama industry by increasing internships, and having invitation-only community-based job fairs for soon-to-be graduates in certain fields.
ACHE plans to conduct a survey of soon-to-be graduates to get a baseline impression of Alabama and career opportunities. Institutional level results from the Employment Outcomes report have been supplied to colleges so those schools can examine in-state demand for graduates by field. They can also target for retention those students in fields where graduates are being lost.
ACHE is helping retain education graduates through incentive programs that help students pay back college loans in exchange for teaching in high need fields and in school systems that face challenges in hiring teachers. ACHE has also helped local communities, most recently Decatur and Demopolis, with initiatives designed to recruit and retain recent college graduates.
[1] U.S. Congress, Joint Economic Committee, Social Capital Project. “Losing Our Minds: Brain Drain across US States.” Report prepared by the Chairman’s staff, 116th Cong., 1st Sess. (April 2019), https://www.jec.senate.gov/public/index.cfm/republicans/2019/4/losing-our-minds-brain-drain-across-the-united-states.
Agenda for Alabama’s Third Century: Raising Educational Attainment for All
While Alabama continues to gain on other states in the percentage of adults with a high school diploma, it is falling further behind the national average when it comes to the percentage of the population with a bachelor’s degree or better.
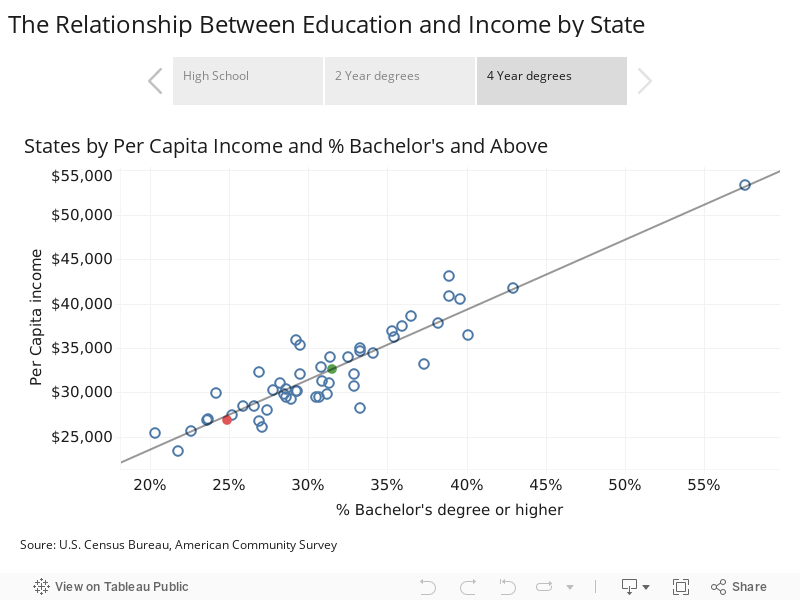
The visualization below shows the correlation between a state’s per capita income and the percentage of adults (individuals 25 years or older) who hold a bachelor’s degree or higher. The greater the percentage of college-educated adults in the state population, the higher the state’s per capita income. And vice-versa. The correlation holds true for the percentage of the population with an associate degrees.
In response to changes in demographics and the economy, Alabama leaders launched a full-court press to raise levels of educational attainment, recognizing that as a cornerstone of future prosperity. The Success Plus initiative brings government, education, and business together around a coordinated effort to raise educational attainment and post-high school advanced skills training, with the goal of adding 500,000 highly skilled workers to the workforce by 2025. In the face of the Coronavirus pandemic, it’s all the more important to sustain educational momentum and prevent the exacerbation of educational inequities that have held Alabama back.
PARCA opened 2020 with an annual meeting in January that challenged speakers to sketch out a vision for our state’s third century. We’re revisiting the central themes explored at that meeting in the coming months, beginning with this installment on educational attainment.
From PARCA’s work with schools and governments, successful organizations follow a process in order to pursue a vision.
Know where you stand and own your data.
Make a plan for improvement, one that includes goals and evidence-based strategies for how to achieve them.
Measure progress toward your goal. Analyze the results.
Celebrate successes. Shift resources and strategy if tactics aren’t working.
This report, as a first step, describes where Alabama stands in comparison to other states in educational attainment.
Narrowing the Gap in High School Attainment
It’s not a surprise that Alabama trails other states. The state is dragged down by its historic underinvestment in education, by the legacy of racially-segregated, separate and unequal schools, as well as continuing inequities and de-facto segregation in some areas.
Here’s the good news: Alabama has shown it can produce dramatic change. When it comes to raising the percentage of adults with high school education, it has, according to Census Bureau data. 1
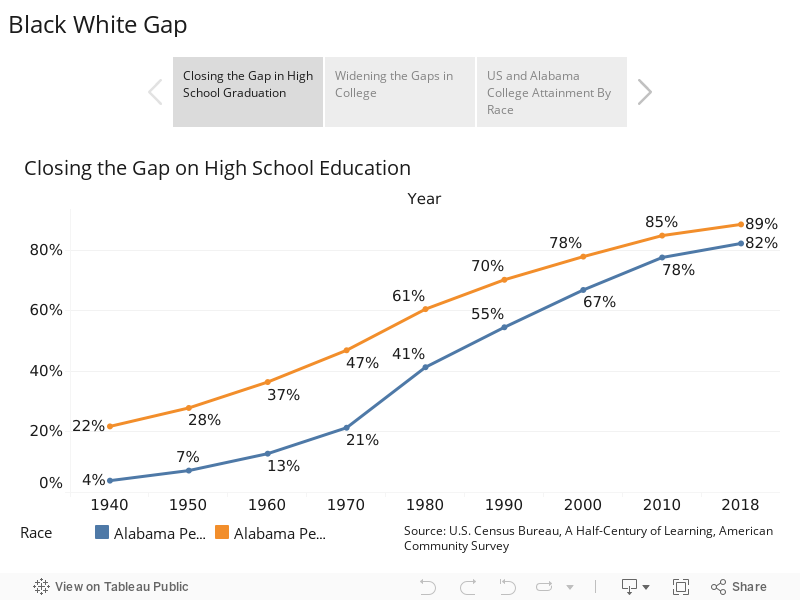
By 2018, Alabama had nearly closed the gap with the US average for the percentage of the state’s adult population with a high school degree.
In 2018, 87% of Alabama adults had a high school degree compared to 88%.
And while work remains to be done, Alabama has also made significant progress in closing the gap between Blacks and whites in high school attainment. In 1940, after decades of Black flight from the South and with segregation still in full force, only 4% of Black adults in Alabama had a high school diploma, compared to 22% of whites. Both races trailed well behind the national averages. By 2018, 82% of Black adults in Alabama had a high school credential compared to 89% of whites. Across the U.S., 85% of Blacks and 93% of non-Hispanic whites have a high school credential.
In spite of advances, Alabama still ranks No. 44 among the 50 states in the percentage of its population with a high school degree, thought the gap between all states is much narrower than it once was.
Falling Behind in Bachelor’s Degree Attainment
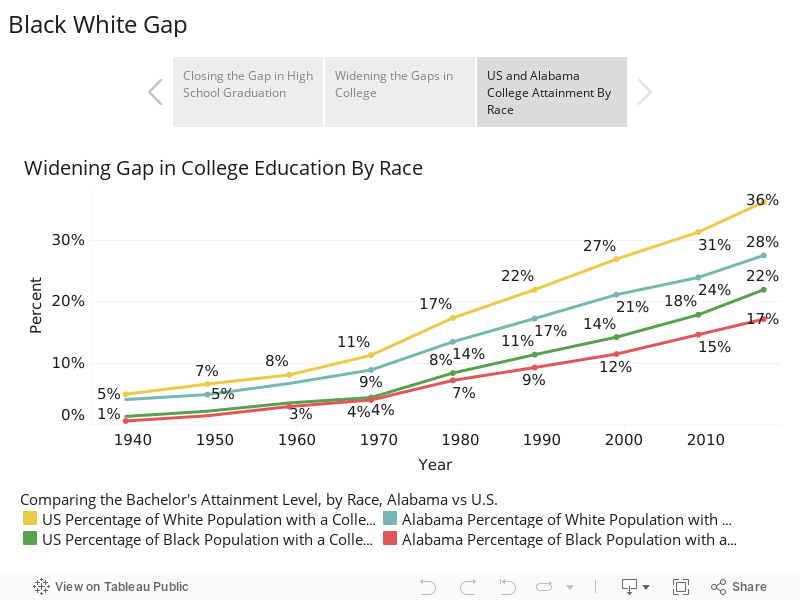
The gap is much wider when it comes to the percentage of the population with a four-year degree. When it comes to bachelor’s degree attainment, Alabama has failed to keep pace with the growth rates in other states.
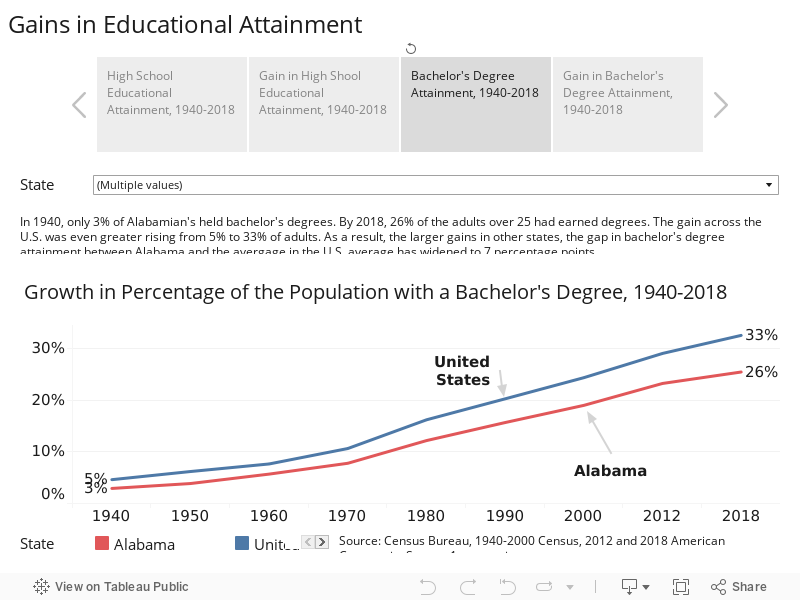
In 1940, the percentage of the population with a college degree was small in Alabama (3%) and the U.S. (5%).
Since 1940, the percentage of the population with a college degree has steadily increased but Alabama’s growth rate has been slower than the national rate, resulting in the current gap of 7 percentage points.
Use the menu to select other states for comparison
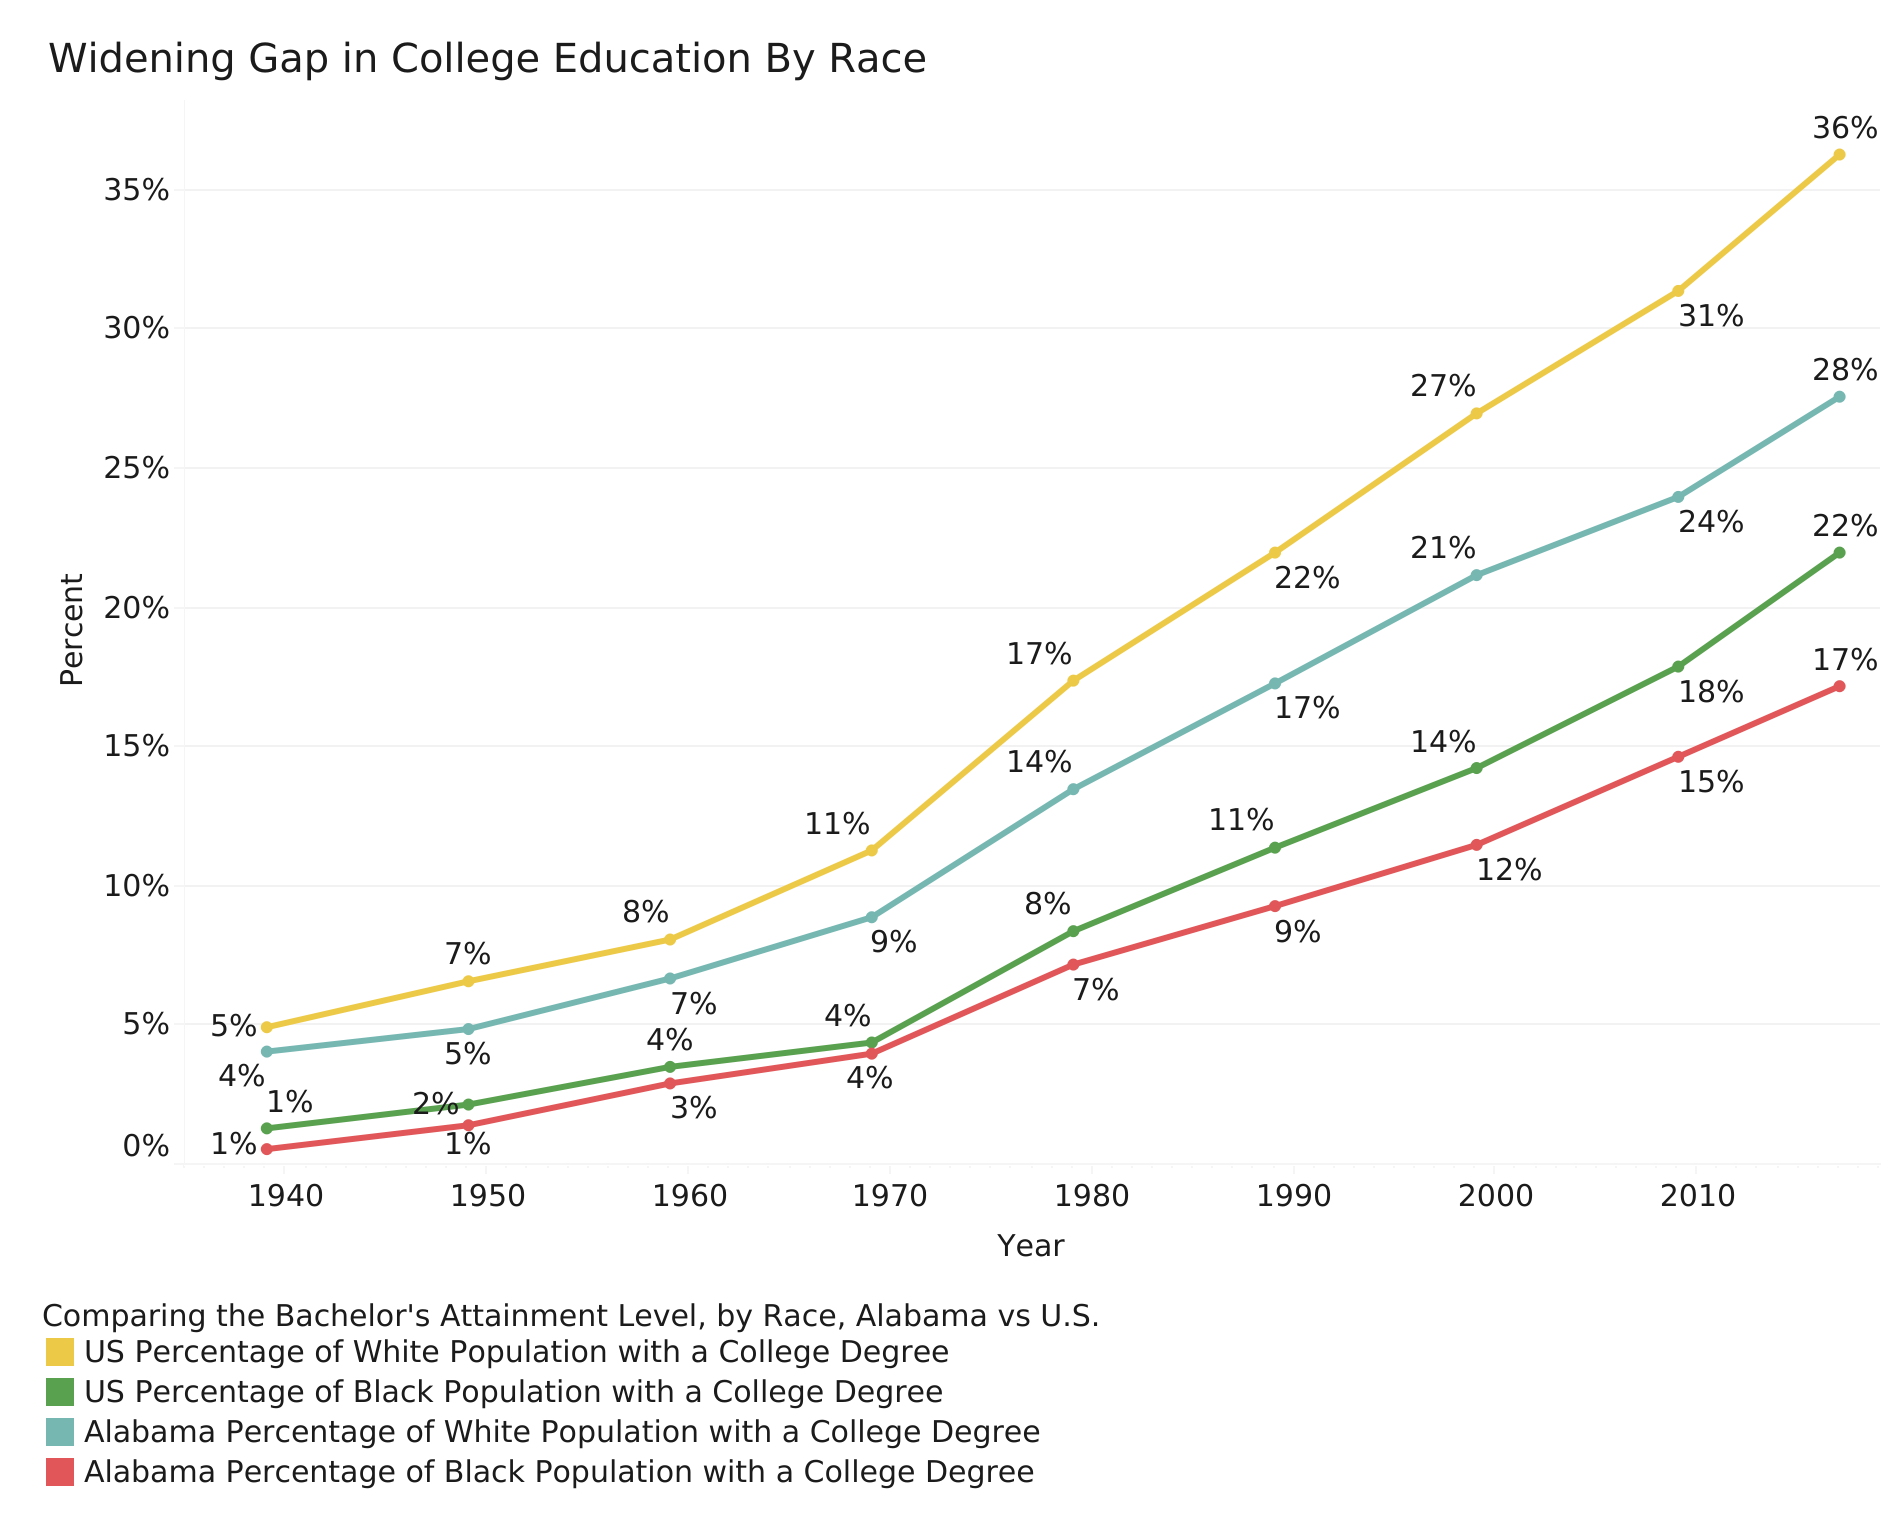
Alabama’s bachelor’s degree attainment trails the national average for both Blacks and whites. Among Alabama whites, 28% of adults have a bachelor’s degree or higher, compared to 36% of whites nationally. That’s a gap of 8 percentage points.
In Alabama, among Blacks, 17% of adults have a bachelor’s degree or higher, compared to 22% nationally. That’s a gap of five percentage points. Throughout this period, more students began enrolling and graduating from college. However, white students nationally and in Alabama seem to have been better positioned to take advantage of this major shift in higher education.
Nationally, the gap in bachelor’s attainment between whites and Blacks is 14 percentage points, compared to a gap of 11 percentage points in Alabama. For both races, the gap with the US average has widened between 2010 and 2018, according to the Census statistics. The percentage point growth in attainment was particularly slow for Alabama Blacks during the latest period, advancing only two percentage points.
These educational attainment measures are not solely attributable to the preparation levels and graduation rates from Alabama K-12 schools or colleges, though the performance of those schools has an effect. Also influencing the equation, particularly in terms of bachelor’s degree attainment, is where Alabama graduates move after college, which is often a function of where career opportunities are available, and the population and wages are growing. Data suggests that many of the states seeing rapid increases in the percentage of the population with bachelor’s degrees are drawing college-educated migrants from other states. Alabama research from the Alabama Commission on Higher Education also finds that the state exports college graduates.
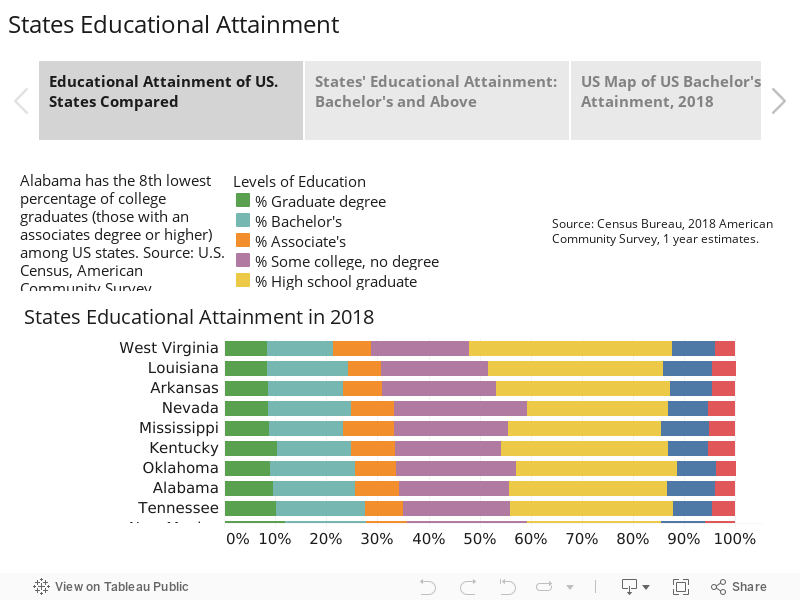
If you want a closer look at how the state’s compare on educational attainment, the visualizations below present a more detailed view. The charts break down the population into segments based on the percentage of the population in each educational category. An individual’s category is determined by his or her highest level of education. The percentage represents the number of people at that level each attainment divided by the total population 25 years and older. In this chart, the states are sorted by the percentage of the population with an associate degree or higher. Use the tabs to explore the states ranked by the percentage of the population with bachelor’s and graduate degrees or the states’ data displayed in an interactive map.
How Does Educational Attainment Compare within the State?
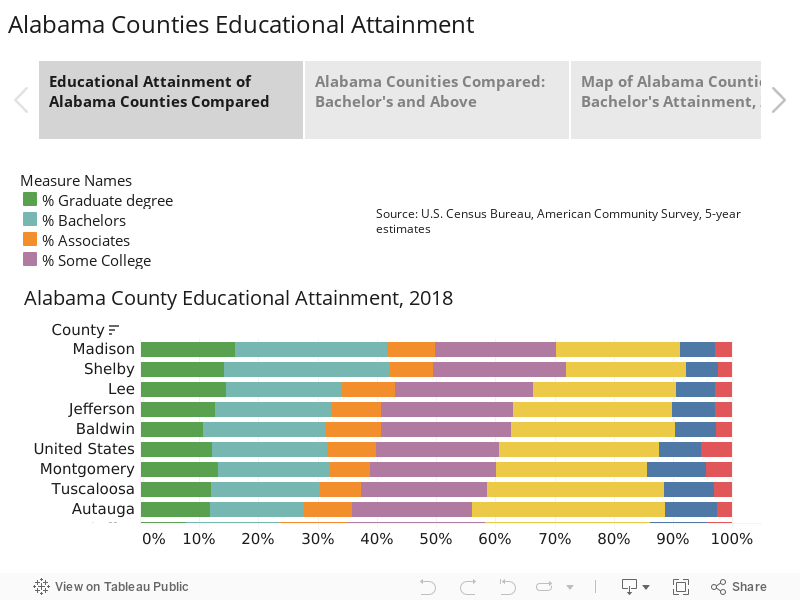
Overall, Alabama’s educational attainment rates may trail the rates of other states, but measures of attainment also vary widely within the state. Educational attainment, as measured by the percentage of the population with bachelor’s degrees or higher, exceeds the US average in five counties: Madison, Shelby, Lee, Jefferson, and Baldwin. Five additional counties exceed the Alabama average: Montgomery, Tuscaloosa, Autauga, Coffee, and Elmore Counties. Those top counties represent most of the major metro population centers plus the university towns. The exception is Coffee County which is home to Enterprise State Community College and includes the residences of many of the personnel, military and civilian, associated with Fort Rucker.
Within the top 20 are a few counties where educational attainment levels are higher than one might expect based on their rural character: Sumter, Pike, and Macon. On closer examination, all three have a university and a relatively small population. Macon County also has a large Veterans Administration Hospital. Pike County is home to some defense contractors and other manufacturing businesses that likely boost the county’s share of credentialed residents.
As in the national context, there is a relationship between education levels and income. In Alabama, the most predictive relationship can be found by comparing county per capita income and the percentage of the population with an associate degree or higher. In general, counties with higher levels of educational attainment have higher levels of income. Educated workers seek out locations where there are concentrations of higher-paying jobs. Higher-paying jobs generally require higher levels of education or training. Businesses seek out locations where there is an ample supply of educated residents so hiring will be easier. Higher incomes generate more business opportunities.
The quest to close the gap
For its first 150 years of statehood, Alabama intentionally operated separate and unequal schools for blacks and whites. And even for whites, the schools weren’t adequate to keep students on pace with the rest of the United States. Through the 1950s, Alabama’s population was predominately rural with an economy oriented to agriculture or blue-collar industry. Alabama’s primary recruiting tools were low taxes, low wages, and cheap land.
The lingering effects of this historic underinvestment in students become apparent in the period of record-low unemployment prior to the pandemic. Despite a booming economy and low unemployment, Alabama continued to have one of the lowest labor force participation rates in the U.S. Businesses struggled to find employees to meet the demands of more technologically advanced workplaces, while a disproportionate number of citizens, primarily those with lower levels of education, stayed stuck on the sidelines.
If Alabama is to reach its full economic potential, the state needs to continue to improve the equity, effectiveness, and efficiency of its educational delivery system. It needs to reach out to adults who need to advance their education. And it needs to retain the graduates its schools produce.
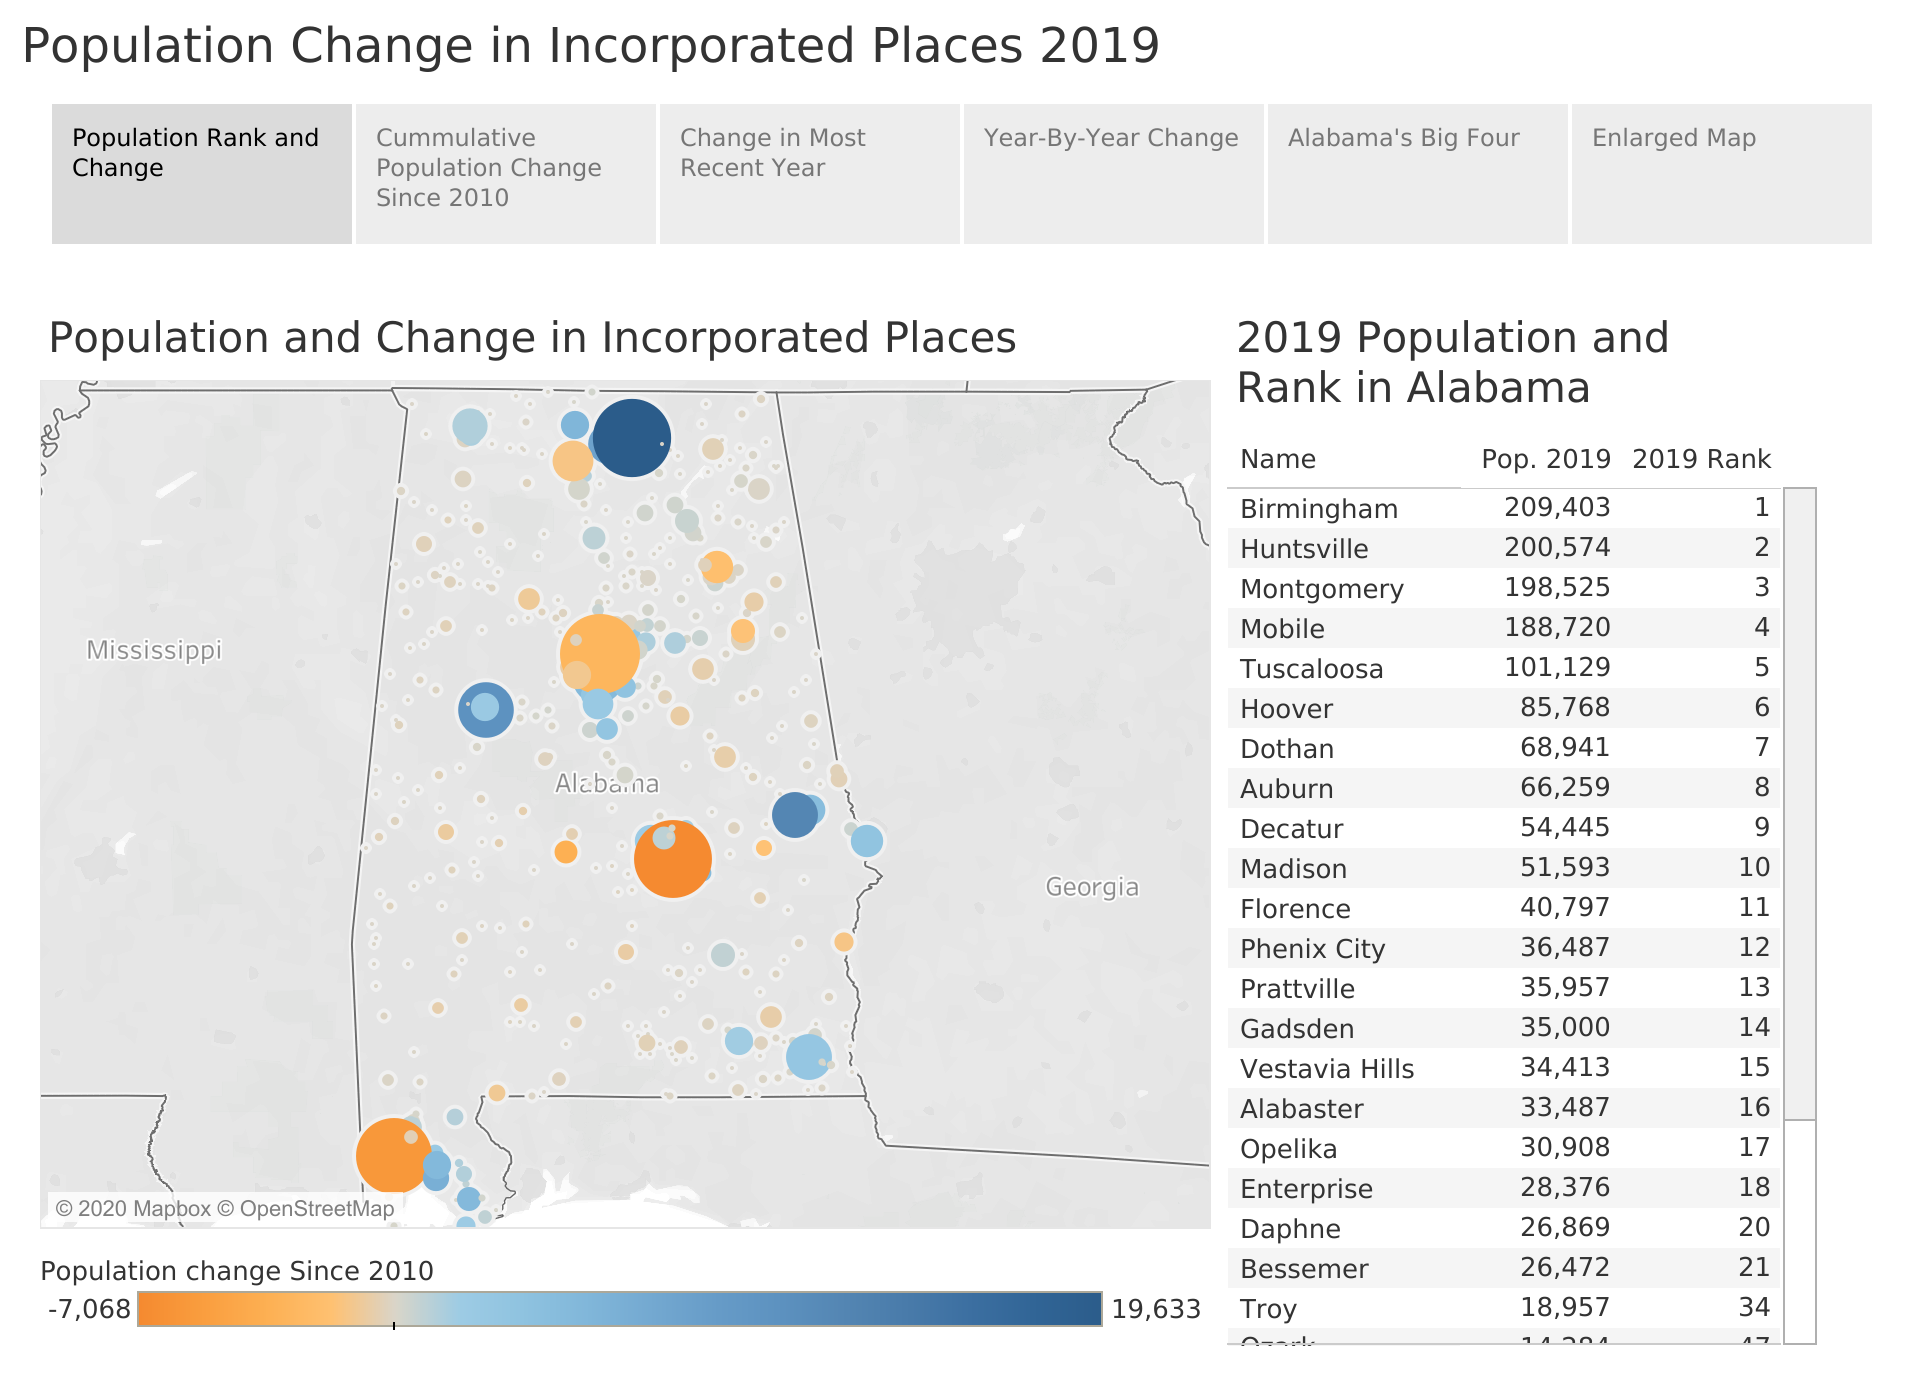
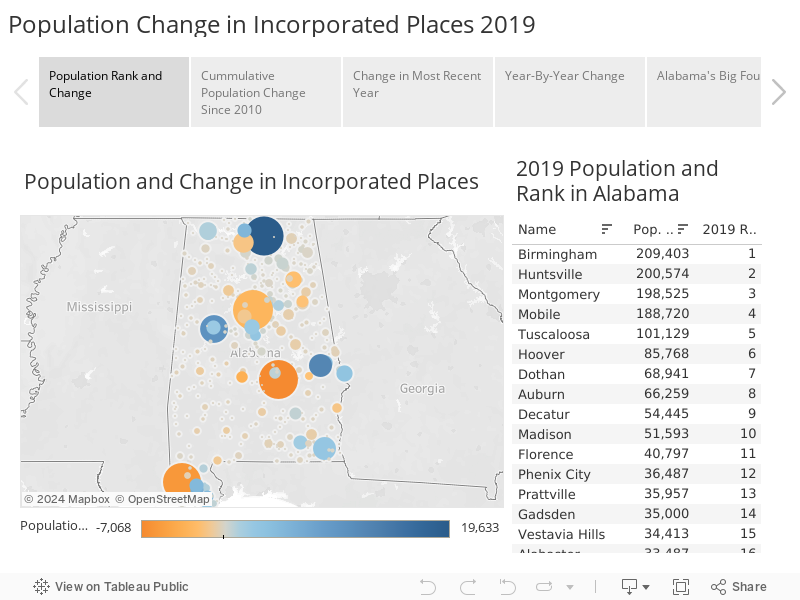
New estimates show Huntsville as the state’s second-largest city.
Huntsville’s population grew past Montgomery’s and crossed the 200,000 mark in 2019, making the Rocket City the second largest city in Alabama.
If those estimates are accurate and current trends prevail, Huntsville will surpass Birmingham within the next three years to become the state’s largest city.
With the official 2020 Census count now in the field, Birmingham should hold on to the top spot when the count comes in. The 2019 estimates have Birmingham’s population at 209,403, down 1,084 from 2018. Meanwhile, Huntsville’s population grew by 2,449, pushing the city to 200,574. The 2010 Census put Birmingham’s population at 212,237 and Huntsville’s at 180,105.
Since 2010, Huntsville has added close to 20,000 residents. During this decade, Huntsville passed Mobile, which in 2019 estimated to have 188,720 residents, and Montgomery which is down to 198,525, after starting the decade with 205,593.
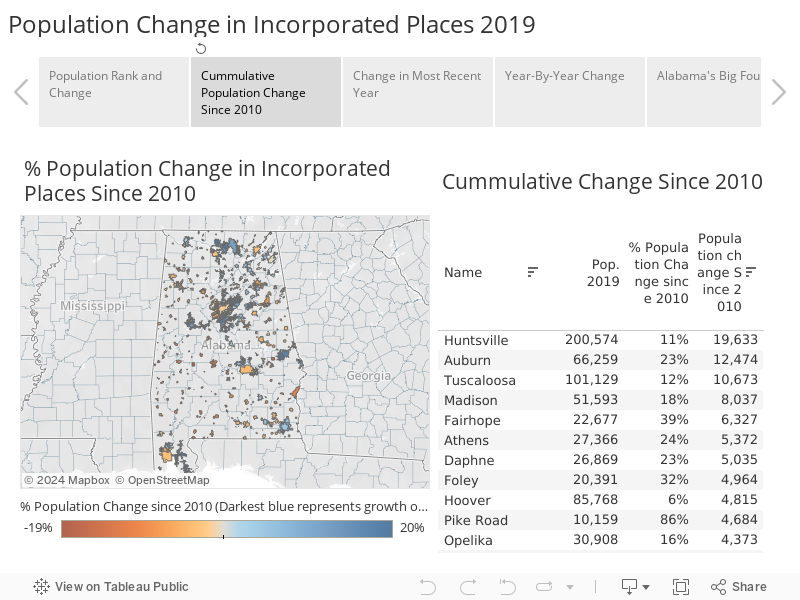
Birmingham’s metro area population is still growing and is more than twice the size of Huntsville’s. Six metro Birmingham suburbs ranked among the top 20 for numerical growth since 2010 including Hoover, Birmingham’s largest suburb. Since 2010, the strongest population growth has occurred in the Huntsville area, in Baldwin County, and in the two college towns, Tuscaloosa, and Auburn and Opelika.
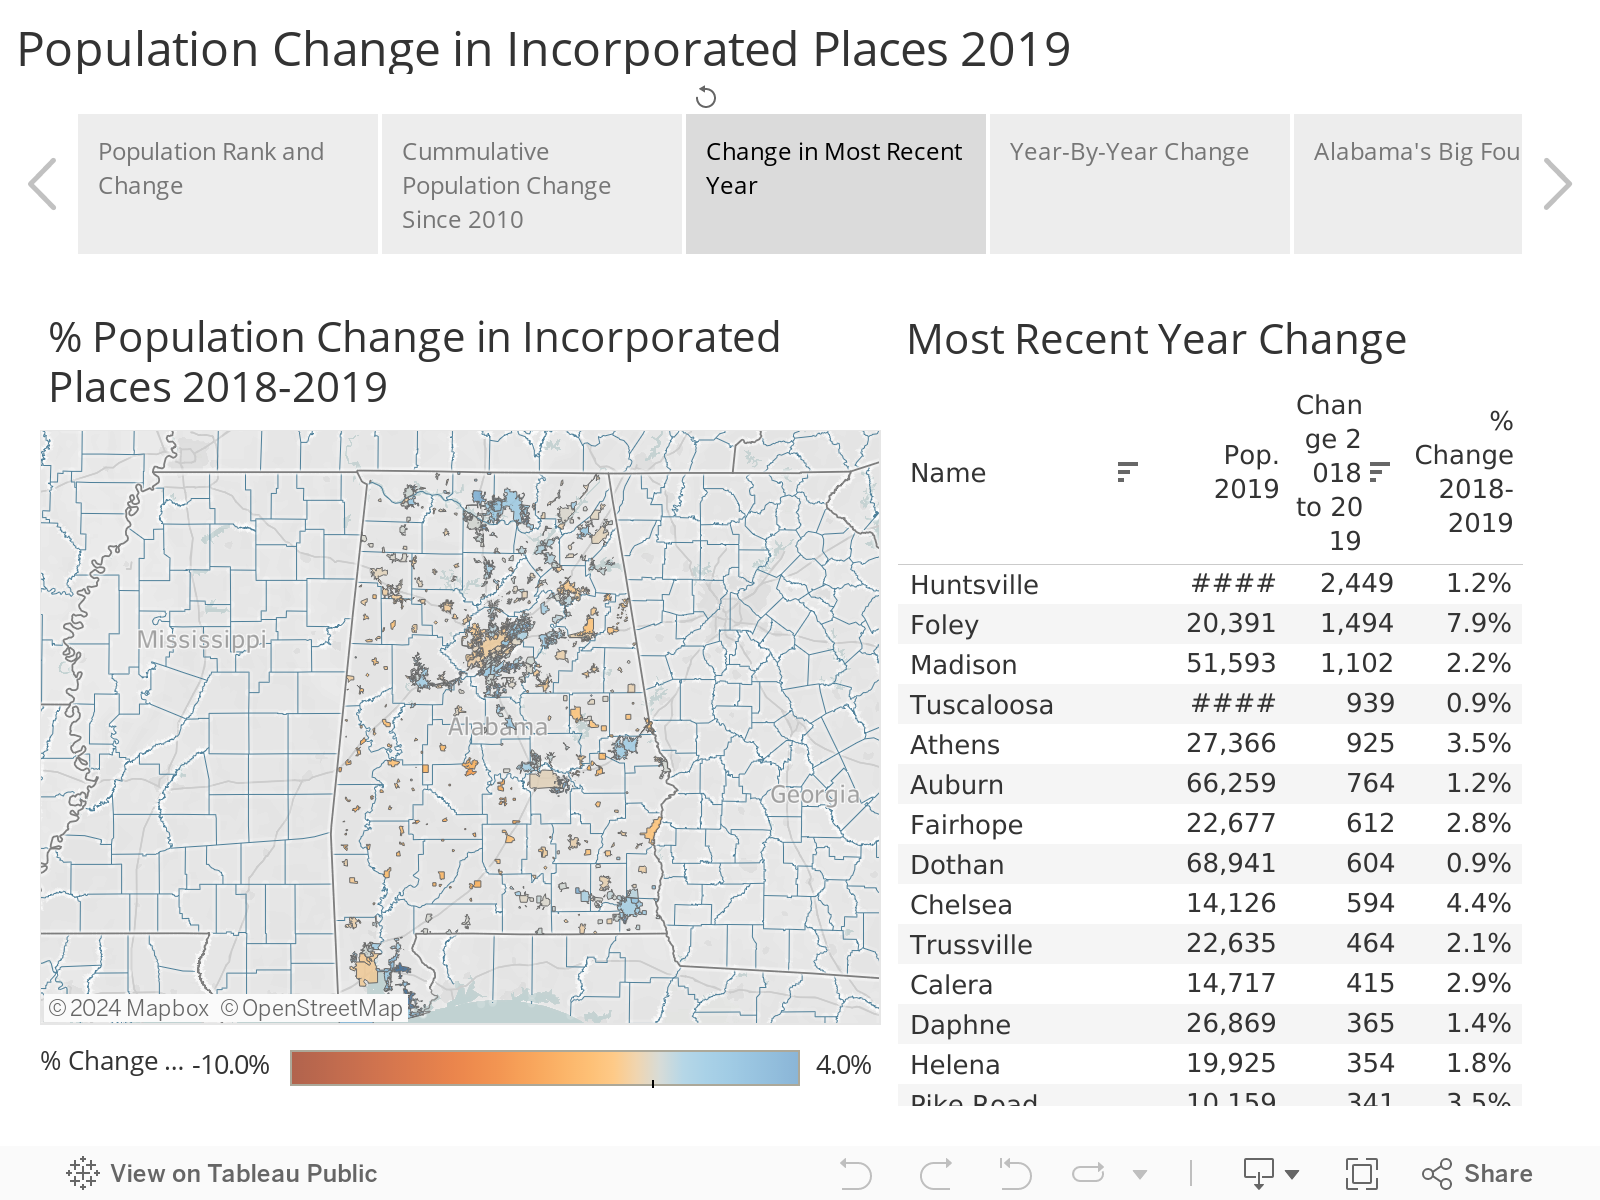
In the most recent year, the population was strongest in the Huntsville area. Beyond the city of Huntsville, its neighbors Madison and Athens both ranked in the top five for numerical growth, each adding around 1,000 residents.
Outside the typical hotspots, Dothan saw growth, adding an estimated 604 residents.
With the exception of some cities in the Wiregrass and the Shoals, cities in non-interstate rural areas lost population in the most recent year estimated and throughout the decade. Selma, Tuskegee, and Eufaula had among the largest declines. Since 2010, Selma is down 3,551 residents, a 17% decline since 2010. That city’s 2019 population is estimated at 17,231.
No one knows what effect the Coronavirus pandemic will have on population trends or how it will affect the ongoing 2020 Census count. The stakes are high for Alabama. Population estimates suggest that Alabama is in danger of losing one of its congressional seats due to relatively slow population growth in Alabama compared to fast-growing states.
The disease outbreak has provided an additional demonstration of why it matters that the population of the state is counted as completely as possible. Much of the federal relief sent to states was distributed on Census population-based estimates.
So far, Alabama’s self-response rate to the Census is better than most other states in the Southeast but trails most states in the Midwest and Mid-Atlantic.
The Census Bureau sent out instructions for responding to the Census in March, either online, by phone, or through the mail. Starting in mid-April, the Bureau mailed paper questionnaires to homes that had not yet responded online or by phone.
Beginning in August and continuing until October 31,Census takers will be in the field interviewing at homes that haven’t responded. If your household hasn’t been counted, you can still respond.
2019 Alabama County and MSA Population Trends
The latest estimates from the U.S. Census Bureau show a more broadly distributed pattern of population growth in 2019 with continued and accelerating strength in north Alabama counties and a surge across south and Southeast Alabama. Published last week, the figures estimate the populations of counties and metropolitan statistical areas (MSAs) on July 1, 2019. Next year’s figures will be based on the actual census count now underway.
Between July 1, 2018, and July 1, 2019, population growth was more widespread in Alabama than it had been the year before: 29 counties saw growth compared to 22 in 2018.
That more dispersed growth included more positive growth in some rural counties, particularly in North Alabama and Southeast Alabama.
To be sure, the hottest spots for growth remain Madison and Baldwin counties’ populations. The Huntsville metropolitan statistical area (MSA), which includes Madison and Limestone, posted the strongest gain among MSAs, with an estimated 8,643 new residents. Nearby counties like Morgan, Marshall, Cullman, Colbert, and Lauderdale also gained.
Houston County, home to Dothan, had been growing steadily over the course of the decade, but in 2019 saw a jump of over 1,000 new residents according to the estimates. The growth in Houston and smaller gains in other counties bordering the Florida panhandle were likely sparked, in part, by businesses and individuals relocating in the wake of Hurricane Michael’s strike in October of 2018.
The tabs at the top of the maps allow you to select between views of numeric, percentage, or rates of change. State and national maps are available. The menus to the right of the maps allow you to toggle through options for the timeframe and select components of change. Maps include county-by-county birth, death, and migration rates.
Metro Areas
The Birmingham metro area continued with slightly positive growth, though the estimates show its central county, Jefferson, losing residents in 2019. Shelby saw a higher gain in 2019 than in 2018, as did St. Clair. Blount, Chilton, and Bibb counties posted gains. Walker County’s population declined.
Montgomery’s MSA saw slightly positive growth thanks to an uptick in growth in Elmore and Autauga counties and far less outmigration from Montgomery County. Nearby, Lee County saw something of a pause to what has been blistering growth in the Auburn-Opelka area. Lee County added 886 new residents, according to the estimates. Lee had been adding more than 2,000 residents a year throughout the decade.
Mobile’s MSA, which consists of Mobile County, lost almost 700 residents according to the estimates. Despite their proximity and interrelation, Mobile and Baldwin County are considered separate MSAs. If the two counties were considered together, Baldwin’s growth would much more than offset Mobile’s losses and the area would be the second-fastest growing MSA in the state in numeric terms. MSAs for Dothan, Tuscaloosa, the Shoals and Decatur showed growth in 2019. The Anniston MSA, consisting of Calhoun County and Gadsden MSA consisting of Etowah County, both lost population.
Non-Metro
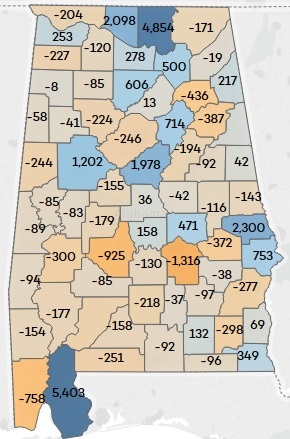
Among non-metro counties, the trend of population loss continued. Rural counties in Alabama’s Black Belt, those along the border with Mississipi, those across south-central Alabama and in east Alabama, with the exception of the I-85 corridor saw population declines in 2019. Losses were particularly steep in Dallas County, which lost over 1,000 residents in 2019, according to the estimates. That was close to 3% of the county’s population. Since 2010, Dallas County is estimated to have seen a 15% decline in its population.
Wider Context
For 2019, the Baldwin County MSA’s annual growth rate of 2.5% ranked 13th out of the nation’s 383 metro areas. Huntsville’s growth rate of 1.9% ranked No. 23. Birmingham ranked No. 229 out of 383, Montgomery, 261, and Mobile, 299.
Looking back to 2010, both Madison and Baldwin counties have added around 40,000 people since the beginning of the decade, according to the estimates.
Alabama’s other big gainers were the major college towns, which also happened to be on automotive assembly corridors. Lee County, home to Auburn, gained almost 25,000 residents since 2010 and Tuscaloosa added almost 15,000. Suburban Shelby County added over 22,000.
Over the same period, Mobile and Jefferson counties were flat in terms of population totals for the decade. Montgomery lost almost 3,000 residents.
Those changes seem modest, but below the surface, major shifts occurred. Each of those counties saw large gains through natural increase (births outnumbering deaths by 10,000 to 15,000). At the same time, though, they exported more residents than they gained through natural increase (15,000 to 20,000 net outbound movers).
However, bringing the large central counties back to even was international migration, with each of the central counties attracting around 4,000 to 6,000 net new arrivals from abroad over the decade.
Adjacent to Jefferson, Shelby and St. Clair Counties continued to grow. Madison’s neighbor, Limestone actually outgrew Madison County in percentage terms. Montgomery’s neighbors Autauga and Elmore gained.
Rural Alabama counties, including both the Black Belt and south-central Alabama, along with the heavily forested counties along the Mississippi border have lost population. In numerical terms, Dallas County has lost the most of any county, with an estimated 6,617 fewer residents in 2019 than in 2010. More urbanized Calhoun County has lost almost 5,000 residents according to the estimates with Walker and Macon counties both losing well over 3,000, as well.
PARCA has updated its interactive maps and charts that allow users to explore local population changes and trends. PARCA tools for state-level population estimates were updated earlier this year. Estimates for cities will be released this summer. The next release of information for county and MSA population totals should come next year from the actual Census count. The Census is currently underway; however, considering the challenges created by the Coronavirus outbreak, it would be impossible to predict when the count will be completed.
The order, part of a State of Emergency declared by Alabama Governor Kay Ivey, states that, prior to April 6th, a decision will be made on whether to extend the order.
These and other measures included in the order are aimed at limiting the spread of the novel Coronavirus, COVID-19. The order’s protective measures mirror steps already taken in Jefferson and its surrounding counties and in Mobile county.
But the true extent of the virus is unknown. The number of confirmed cases does not equate to the prevalence of the virus in a county. Testing has been slow to deploy. Results are not delivered for 24 to 72 hours. In some cases, long lines form at announced test sites, overwhelming their ability to take samples, and perhaps indicating high demand.
PARCA is updating a Coronavirus Resources page, which can be accessed to the right of the main menu on the homepage.
Alabama State and Local Resources for following Coronavirus COVID-19
Responding to the spread of Cornavirus, Alabama’s State Health Officer ordered Tuesday that in Jefferson and surrounding counties, public gatherings of 25 people or more are prohibited until further notice, and restaurants have been ordered to cease on-site dining operations.
According to the Alabama Department of Public Health (ADPH), the state had 39 confirmed cases of the novel Coronavirus, COVID-19, as of Tuesday, March 17, at 3:30 p.m. Jefferson County had the highest number of cases with 21. (For updates, PARCA has established a PARCA’s Coronavirus Resource page, updated tallies are available directly from ADPH here. And AL.com has established a Coronavirus update page for breaking news).
Wilson on Monday said evidence indicates the virus is now spreading in the Jefferson County community. Wilson ordered that bars and restaurants cease offering on-premise dining, that daycares and private schools close, and that senior residential facilities take additional steps to restrict visitation and mingling within the facility. Gatherings of more than 25 people are prohibited. State officials said Tuesday that those same orders are being extended to Tuscaloosa, Blount, Walker, Shelby, and St. Clair Counties. Text of the state order is here.
In support of the work of the government and health care professionals involved in the Coronavirus containment effort, PARCA plans to gather and share information and resources on a daily basis as the situation unfolds. Check back on our PARCA’s Coronavirus Resource page for updates.
The Alabama Department of Public Health (as of March 17) has not yet ordered restrictions in the rest of the state. However, they strongly recommend that people statewide take steps to limit the spread. Those include:
No mass gatherings of 50 persons or more, or gatherings of any size that cannot maintain a consistent six-foot distance between participants. This may include festivals, parades, assemblies, or sporting events.
Senior adults or those with chronic health problems should avoid gatherings (outside of close family) of 10 or more persons, and should avoid travel by air, train or bus.
For retail businesses, including restaurants, limit patronage at any one time to 50% of the normally allowable capacity. Restaurants should maintain a six-foot distance between tables.
Public buildings should consider whether visitation may be limited. Hospitals, nursing homes and assisted living facilities are encouraged to implement visitation policies that protect vulnerable persons.
All persons should consider whether out-of-state travel plans may be delayed or canceled.
Participants in religious services or events, weddings, funerals, and family events should exercise prudence and maintain consistent six-foot distance between participants if possible.
For individuals and families, wash your hands, avoid crowds, and in public maintain a six-foot distance from others. Work from home if possible, and, if sick, stay home.
If You Feel You Need Testing for the Virus
If you suspect you have contracted COVID-19 and are experiencing symptoms, the Alabama Department of Health asks that you contact your health care provider to arrange for testing.
For those without a regular provider, call 1-888-264-2256 to find out about testing in your area.
For Travelers Returning from Affected Geographic Areas
Help Wanted: Alabama’s Labor Force Participation Problem
Alabama has record low unemployment, one of the lowest unemployment rates in the country.
And yet, the percentage of Alabamians actually
working is lower than almost any other state.
This seeming paradox explains, in part, why Alabama has lower per capita income than most other states and higher rates of poverty, despite those historically low unemployment numbers. To be counted as unemployed, you have to be looking for work, or in other words, participating in the labor force.
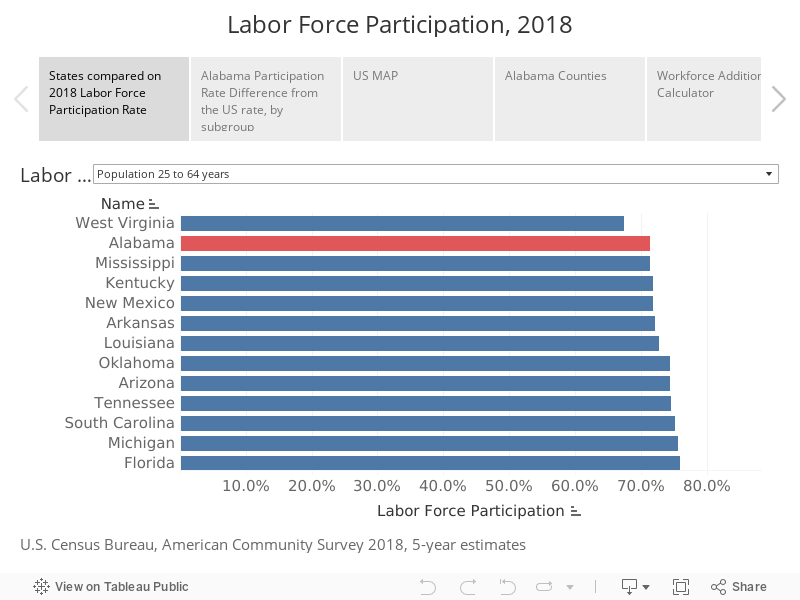
In 2018, Alabama’s labor force participation rate was lower than all other states, except West Virginia (we’re tied with Mississippi). As measured by the American Community Survey, 71% of Alabamians, ages 25-64, were working or looking for work. That compares to the U.S. labor force participation rate of 78% for that age group.
If Alabama’s labor force participation rate equaled that national average, Alabama would have almost 160,000 additional workers in the workforce in that age range.
Low labor force participation is a significant problem for Alabama, one that has been recognized by Gov. Kay Ivey’s Administration and the Alabama Workforce Council in its Success Plus Initiative (for more information on this initiative see Education Matters, a report from the Business Education Alliance authored by PARCA. You can also read the Alabama Workforce Council’s latest update on the effort).
Increasing the state’s labor force participation rate is one of the key objectives identified by Success Plus for helping Alabama meet its goal of adding 500,000 highly skilled workers to its workforce by 2025. The state will not reach that goal without bringing significant numbers of those who have dropped out of the workforce back in, which in most cases means equipping them with supplemental education and skills needed to thrive in today’s work environment.
Who is missing?
Before we can bring people back into the workforce, we have to understand who’s missing in the first place, and which groups of Alabamians have dropped out at a higher rate than residents of other states.
Using data from the U.S. Census Bureau’s American Community Survey (ACS) for 2018, PARCA examined the labor force participation in Alabama in comparison to other states and to the nation as a whole. We used five-year estimates because that survey provides estimates for smaller counties not present in the one-year estimates.
A comparison of one-year estimates yields similar results. However, it should be noted that in the 2018 one-year estimates, labor force participation in Alabama did show an increase over 2017, from 70.5% to 71.4%, after a multi-year downward drift. Whether that is a result or the economy or policy focus, it would be hard to determine, but, hopefully, it is part of a trend. For comparison, before the Great Recession, Alabama’s labor force participation rate was 75% for that age group and the national rate was 80%.
Sharpest differences with the rest of the U.S.: Age, Income, and Disability
Alabama trails the rest of the U.S. labor force participation rate across the board. When you break the population down into subgroups by age, sex, race, economic condition, or educational attainment, in almost every subgroup, Alabama’s rate trails the U.S. rate. However, in some subgroups, the divergence from the national rate is particularly sharp.
In comparison to the same population groups in other states, older Alabamians and Alabamians with lower levels of education are less likely to participate in the labor force, according to Census figures. Alabamians with a disability are also less likely to participate in the workforce than their counterparts in other states. The labor force participation rate for those groups is roughly 10% lower in Alabama than it is for similar individuals across the U.S.
The gap with the U.S is most extreme when it comes to individuals with less than a high school education. In Alabama, only 49% of individuals who lack a high school diploma are working or looking for work. That compares to a labor force participation rate of 61% nationally for those with less than a high school education.
Older workers in Alabama are also disproportionately out of the workforce. The labor force participation rate of those 60 to 64 is 10 percentage points lower in Alabama than it is in the rest of the country: 46% of Alabamians ages 60-64 participate in the labor force compared to 56% nationally. For those between 55-59, Alabama’s labor force participation rate is 63% compared to 72% nationally.
Age remains a factor in those between the ages of 45 and 54; Alabama’s rate is almost 7 percentage points lower than the U.S. average. For those 44 and younger, the gap between the Alabama workforce participation rate is narrower, though Alabama’s rate is still 3 to 4 percentage points lower than the U.S. rate.
You find a similar pattern with educational credentials: the more education an Alabamian has, the more likely he or she is to participate in the workforce. As the education level rises, the gap with the U.S. rate closes: 84% of Alabamians with a bachelor’s degree or higher participate in the workforce compared to 86% nationally.
When it comes to individuals who report having a disability, Alabama also has lower rates of labor force participation than other states, with the labor force participation rate among disabled individuals in Alabama trailing the national average by 9%.
You can explore state and national rates of workforce participation in the map below. Use the selector at the top to choose the population group to measure.
The impact of Alabama’s labor force participation deficit in these subgroups is amplified because Alabama’s population is older, less educated, and more disabled than the country as a whole. Alabama’s median age is 38.7 compared to 37.8 in the US; 25% of Alabamians have a 4-year degree compared to 32% across the country; 11.6% of Alabama’s population reported a disability compared to 8.6% nationwide.
What does not impact our labor force participation rate
Alabama’s racial diversity does not affect the state’s labor force participation rate, though if Alabama was more diverse, our labor force participation rate might be higher.
Non-Hispanic whites (ages 16 and up) have the lowest labor force participation rate of the major racial and ethnic groups, just under 57%, lagging non-Hispanic whites nationally by 5.4 percentage points. Blacks in Alabama have a labor force participation rate of just over 57%, lagging the U.S. rate by 5.2 percentage points. Alabama Hispanics have a labor force participation rate of 67%, which is less than a percentage point difference from the U.S. labor force participation rate for Hispanics.
It is sometimes assumed that Alabama’s supposed preference for traditional gender roles might depress the labor force participation rate for females in Alabama compared to the rest of the U.S. However, if those attitudes produce any effect, it is slight. The female labor participation rate in Alabama is 66.4%, trailing the national average by 6.2 percentage points. That’s only slightly higher than the gap for males. The male labor force participation rate in Alabama, 76.6%, trails the U.S. rate by 5.6 percentage points. In fact, one subset of the female population in Alabama participates in the workforce at a higher rate than the U.S. rate. Alabama females with children under 6 are more likely to be in the workforce than similarly situated women nationwide. According to the Census figures, 71.4% of those mothers participate in the labor force.
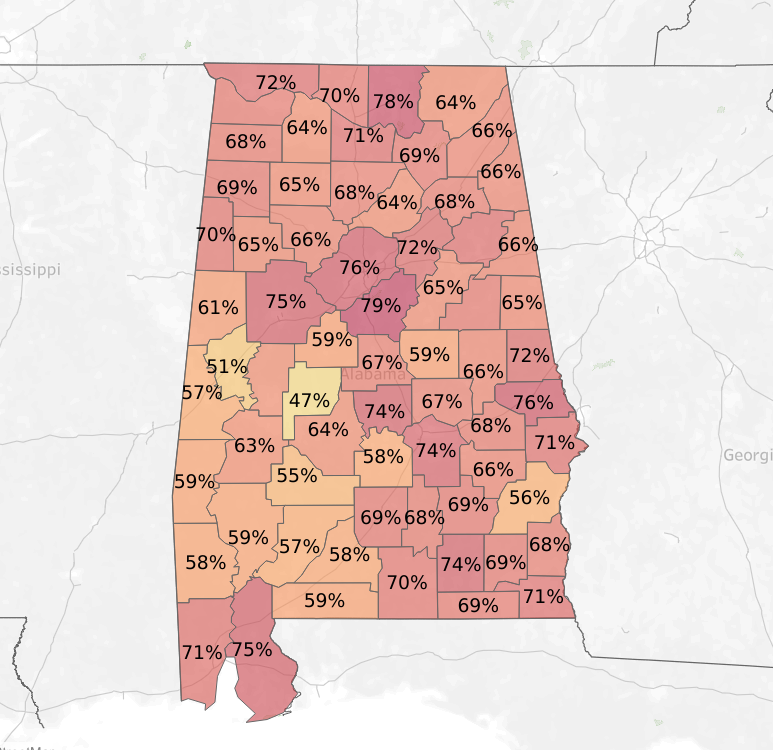
Geography matters
Alabama’s rural counties have the lowest labor force participation rates. Meanwhile, the most urbanized and affluent of Alabama counties have the highest rates of labor force participation.
One might conclude that it would be best to recruit workers back into the workforce by targeting rural counties where labor force participation is lowest. However, this neglects the fact that the largest population of workers who aren’t participating in the workforce are in metropolitan counties. That’s also where unemployment is lowest and jobs are clustered. Both rural and metropolitan counties need strategies for increasing labor force participation.
The visualization below allows you to calculate how many additional workers could be added to the workforce in the selected geography if that geography matched the U.S. labor force participation rate for the selected subgroup. The two subgroups selectors on the dashboard, one for the subgroup population and one for the subgroup labor force participation rate must be set to the same subgroup to produce accurate calculations.