PARCA Annual Survey of Public Opinion 2016

Loader Loading…
EAD Logo Taking too long?

Reload Reload document
| Open Open in new tab

In January 2016, The Public Affairs Research Council of Alabama conducted its annual poll of public opinion. This is the 10th year of the survey. This year, the survey focuses on revenue and spending in state government. The survey touches on multiple topics: taxes, education, Medicaid, highways, public safety, courts, state parks, and others. The complete survey results are posted in presentation form above. Text of the questions and results are presented at the bottom of this post. Highlights are featured below. An in-depth audio-visual presentation of the of the results is also available here.

The survey of 466 Alabamians was conducted between January 4 and January 21. Randolph Horn, Samford University Professor of Political Science and Samford’s Director of Strategic and Applied Analysis, collaborated with PARCA on the design of the survey and directed the polling operation. The results were weighted to reflect the demographic makeup of the state.

Respondents ranked education as the most important investment the state makes followed by health care, public safety, and highways. All four areas are underfunded in Alabama, according to a majority of respondents.

In the areas of education and health care, majorities said they would be willing to pay more in taxes the avoid cuts or achieve adequate funding. In the areas of public safety and highways, less than a majority would be willing to pay more in taxes to avoid cuts or achieve adequacy.

A majority said the state needs more revenue to support state services.

Respondents perceive that state and local taxes fall more heavily on lower-income Alabamians than higher income range. A plurality of respondents say that lower-income residents pay too much in state and local taxes and a majority say that that those in the upper-income group pay too little.

Given options for how the state might increase tax revenue, the only option receiving majority support was to make the state income tax more progressive by increasing the percentage of income that high-income individuals pay in state income taxes.

Looking more closely at more targeted areas of state investment, a majority of respondents said state parks and state troopers are not adequately funded. Opinions were more mixed when it came to state courts and driver’s license offices.

But none of those areas received majority support when respondents were asked if they were willing to pay more in taxes to support them.

A majority of respondents support expanding Medicaid to cover more people. The same question was asked last year and received the same level of support.

On most questions, Alabamians, whether Democrat or Republican, black or white, are relatively united in opinion. However, the response to the Medicaid question does show a partisan divide with majorities of Democrats and independents supporting expansion while a majority of Republicans support maintaining the system as it is.

Strong majorities felt that officials in Montgomery did not care about their individual opinions. This is consistent finding over time.

That distrust of elected officials is perhaps reflected in respondents’ support for earmarking state revenue. Earmarking is defined as designating revenue raised from a particular source to be spent for a particular purpose. An example would be Alabama’s earmarking of income and sales tax revenue for public education.

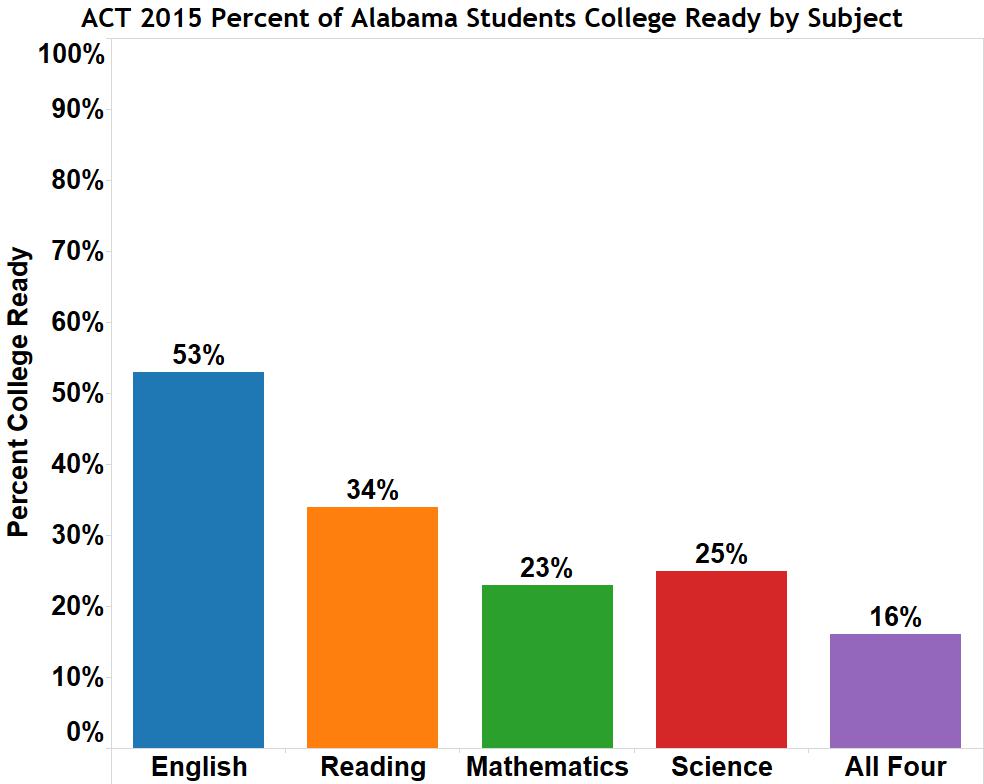
When it comes to education spending in Alabama, respondents had particularly strong opinions: 69 percent said the education budget should be kept separate from the budgets funding other state services; 70 percent said too little is being spent on education; over 80 percent said the level of funding for schools makes a difference in educational quality; 86 percent said that the state should make up the difference if a community is too poor to support schools adequately.
In terms of what areas are most need of investment in education, respondents showed the strongest support for spending more on teacher’s salaries, with 71 percent supporting increasing teacher salaries. Increasing spending on technology infrastructure, hiring more classroom teachers, school security, classroom technology, and music and the arts all received majority support.

The full text of questions and results is included below.

Loader Loading…
EAD Logo Taking too long?

Reload Reload document
| Open Open in new tab
Loader Loading…
EAD Logo Taking too long?

Reload Reload document
| Open Open in new tab

College-Going Rates by High School

The Alabama Commission on Higher Education has produced a new set of data that gives a more complete picture of the college-going rate statewide and for individual high schools. According to the data, of the 45,760 students who graduated in the spring of 2014:

–     33 percent enrolled in two-year colleges

–     32 percent enrolled in four-year colleges and universities

–     35 percent of graduates did not enroll in higher education in the year after their graduation

Historically, ACHE, the state’s coordinating agency for higher education, has surveyed Alabama public colleges, both two-year and four-year, in order to determine the number of Alabama public high school graduates who enrolled in college the year following their high school graduation. In determining college-going rates, that data had limitations because it only tracked those students who enrolled in Alabama public colleges. Students who went to private schools or went out of state were not counted.

Now, drawing from data compiled by the National Student Clearinghouse, ACHE can follow the enrollment of all public high school graduates whether they go to public or private schools after graduation, both in-state and out of state. The new data that gives a more complete picture of college-going rates.

That data is presented in the interactive charts below.

Plan 2020, Alabama’s strategic plan for public education, sets a goal of having 90 percent of students graduate on time and that those students who do graduate are ready for college and/or career. To some extent, this college-going rate is a reflection of how well schools are doing at producing graduates who are ready to go into higher education. However, it is very important to realize that college-going is highly correlated with a student’s socio-economic status. High schools that have a more affluent student population will see a much higher percentage of their students proceed directly into college. Schools that work with more low-income students will have a lower college-going rate.

Regardless of their demographic makeup, all schools and systems should be looking for ways to promote college access for their graduates. A study published this month by the Pew Research Center found that the middle class is shrinking as a percentage of the population. According to Pew’s analysis of government data, education levels are a key factor in an individual’s economic prosperity. Individuals with a bachelor’s degree or higher are experiencing economic gains, with and increasing share of them moving into upper-income brackets. On the other hand, those without a college degree are slipping farther behind.

Along with the broad effort by public schools to improve students’ preparation for college, there are also targeted efforts underway to increase college-going rates by better connecting students with the resources they need to pay for college. To access financial aid available to help pay for college, students must fill out a Free Application for Federal Student Aid (FAFSA). The FAFSA form is notoriously difficult to complete, but successful completion of the form greatly increases the chances a student will enter college. According to the U.S. Department of Education, 90 percent of students who complete a FAFSA form attend college the following fall. Cash For College is a statewide FAFSA completion campaign coordinated by Alabama Possible, a non-profit working to combat poverty. Alabama Possible is working with the Alabama State Department of Education, local schools, and higher education institutions to boost FAFSA completion. The organization provides tools, data, and strategic approaches that schools can use to boost FAFSA completion rates, with an end goal of helping more students enter and pay for college.

Cash For College is a statewide FAFSA completion campaign coordinated by Alabama Possible, a non-profit working to combat poverty. Alabama Possible is working with the Alabama State Department of Education, local schools, and higher education institutions to boost FAFSA completion. The organization provides tools, data, and strategic approaches that schools can use to boost FAFSA completion rates, with an end goal of helping more students enter and pay for college. Information on how to participate is available on the Alabama Possible website.

The charts below allow you to examine the rate of college-going by county, by system, and by individual school. The charts allow you to look at the percentage of students who enroll in four-year schools, two-year schools, and the percentage of graduates who haven’t enrolled. This set of data looks at the high school students who graduated in the spring of 2014. The National Student Clearinghouse database was then checked in July of 2015 to determine whether those high school graduates had enrolled in higher education the year following their graduation.


Lowest Per Capita Tax Collections in the Nation

Alabama once again ranks last in per capita state and local tax collections, according to new data released by the U.S. Census Bureau. Alabama has consistently maintained its No. 50 ranking since the early 1990s.

As a result, Alabama state and local governments have less to spend than governments in other states when providing services to the public. This lack of revenue is an underlying factor in the state’s recurring budget problems. The Governor and Legislature struggle to find enough money to adequately support the functions of state government. In the past several years, the government has made cuts to programs, borrowed from the state savings account, and applied one-time sources of money to balance the budget.

In 2015, the Legislature couldn’t agree on a General Fund budget until September, putting in place a budget just before October, the beginning of the 2016 fiscal year. Again, agencies’ budgets were cut, funds were shuffled between accounts, and modest tax increases were passed to balance a bare bones budget. The most recent comparative data available from the Census is from 2013, so the effects of the tax changes made in 2015 won’t show up for several years. However, the minor changes are unlikely to affect Alabama’s No. 50 ranking.

Low taxes per capita don’t necessarily mean low tax burdens for everyone. A mix of different taxes make up total tax collections, and each state structures its taxes differently. There are three principal types of state and local taxes: property, income, and sales. A tax system that is balanced among these three sources promotes fairness and stability. Alabama’s tax system is not balanced. Alabama has the lowest property tax collections in the country. To make up the difference, Alabama relies more heavily on sales taxes.

The rules governing how taxes are applied also makes a difference in who pays them. In Alabama, property taxes are structured in a way that benefits homeowners, and owners of land in use for agriculture or timber. Commercial and utility property owners pay more than those protected classes.

Meanwhile, Alabama’s average combined state and local sales tax rates are 4th highest in the country, according to the Tax Foundation. Those taxes fall most heavily on low-income Alabamians since they spend a greater share of income on goods that are taxed. Many states attempt to lighten the burden by exempting groceries from the sales tax or giving an income tax rebate to low-income families. According to the Center for Budget and Policy Priorities, only two states, Alabama and Mississippi, allow the full weight of the sales tax to apply to groceries.

Concerning the income tax, most states employ measures to minimize the income tax that low-income households have to pay. Alabama, by contrast, begins taxing income at one of the lowest thresholds in the U.S. Alabama is one of only three states that allows taxpayers to fully deduct federal income tax paid, when calculating their tax bill. That tax break provides a larger benefit for more affluent families, who pay more in federal taxes.

Here’s how Alabama tax revenues per capita rank in the various categories of taxation.

Alabama has low tax collections per capita for two reasons: low tax rates and a relatively small tax base. One way to measure a state’s tax base is to look at gross domestic product, the value of all goods and services produced in a state. Alabama ranks 45th among U.S. states on GDP per capita. In the Southeast, Louisiana, North Carolina, Georgia, Tennessee, Kentucky, and Florida have higher per capita GDP than Alabama. Arkansas, South Carolina, and Mississippi have lower per capita GDP. Alabama applies low tax rates to a smaller taxable base to produce the lowest taxes per capita, not only in the region, but also in the nation at large.

In the interactive presentation below, Alabama’s tax collections are compared to other Southeastern states. In general, these states have similar demographics and similar attitudes toward taxes and the size of government. Using the geography menu, you can change the comparison states.


Education Trust Fund Grows but School Spending Still Behind

Receipts to Alabama’s Education Trust Fund grew by 4.2 percent in FY2015, according to year-end revenue reports, allowing the state to finish repaying the education’s borrowing from the state savings account and to begin socking away additional savings for the next downturn.

It should be noted, however, that for the current budget year, state support for local K-12 schools is still lower than it was in 2008.

The total received by the ETF, the account that pays for K-12 and higher education, climbed from $5.8 billion to $6 billion. Proceeds from the state sales tax were up 3.25 percent, and individual income tax totals increased 4 percent. Gross corporate income taxes collections were up substantially, but a big chunk of that was due to a one-time infusion of $90 million that came as the result of an audit. Leaving out that $90 million, gross collections were up 1.75 percent. At the same time, though, refunds to companies paying the corporate income tax were down. As a bottom line, when the one-time payment is factored out and the refunds factored in, receipts from the corporate income tax were up 6.3 percent. The chart below summarizes the receipts to the Education Trust Fund.

The growth allowed the state to repay prior obligations and to begin reserving money to offset future downturns. From the sales tax, $24 million was spent to restore the financing of the state’s pre-paid tuition program (PACT). Another $58 million was used to repay the Alabama Trust Fund for withdrawals from the Rainy Day Fund made during the Great Recession. The Rainy Day Fund is a pool of money within the oil and gas trust fund that can be drawn on to prevent mid-year budget cuts, known as proration.

In addition, the 2011 Rolling Reserve Act places a cap on the amount ETF spending can increase each year. Those limitations on the 2015 budget resulted in the ETF ending the year with a positive balance of $140 million. Of that, $118 million will be held in what’s known as the Budget Stabilization Fund. In the event of an economic downturn, that will provide an additional cushion against proration. The other $22 million of that 2015 balance will be deposited in an Advancement and Technology Fund, which the Legislature can tap to pay for repairs or deferred maintenance of facilities, for classroom instructional support, for insuring facilities, for transportation, or for the acquisition and/or purchase of education technology and equipment.

The 2016 budget makes $4 billion in state funds available to support local schools. By comparison, the 2008 budget allocated $4.3 billion. Allocations for technology, textbooks, professional development, transportation, classroom supplies, and student materials are still well below 2008 levels.


From Governing: How Mobile, Alabama, Used Instagram to Address Blight

Like many cities, Mobile, Ala., didn’t even know how many blighted properties it had. Instagram offered a cheap and simple way to start figuring that out.

Mobile’s use of social media tools to combat urban blight is featured in a recent post on Governing Magazine’s States and Localities blog. Read about the work of Mobile’s innovation team, which was made possible by a three-year $1.65 million grant from Bloomberg Philanthropies.

Source: How Mobile, Alabama, Used Instagram to Address Blight


General Fund Sputters Along

Despite the healthy economy, the state’s General Fund posted its usual sputtering performance in 2015, according to the state’s year-end revenue collection reports.

The General Fund, which supports the non-education functions of state government, received about $1.8 billion in 2015, up from approximately $1.7 billion in 2014. However, that total includes a $105 million transfer from a business tax escrow account. Without that one-time transfer, General Fund revenue collections would have been up just 1.4 percent over 2014. And in both 2014 and 2015, the General Fund was supplemented with $146 million in borrowing from the Alabama Trust Fund.

Neither the $146 million nor the $105 million will be available for 2016. That’s the scenario that set the stage for the Legislature’s protracted struggle to pass a budget for 2016. Anticipating that $251 million hole, the Legislature balanced the 2016 General Fund budget by cutting state agencies, adding some new revenue by raising the cigarette tax, and shifting more of the use tax from the Education Trust Fund to the General Fund.

Those measures will allow the General Fund to sputter along another year, but they won’t solve the long-term problem: The General Fund’s hodgepodge of taxes don’t grow at the same rate as the economy. As the cost of those non-education services rises, the General Fund doesn’t keep pace.

The chart below lists the revenue sources that supply the General Fund and compares performance in 2015 to collections in 2014. A discussion of major fluctuations follows the chart.

Abandoned Property: Each year, financial institutions and businesses that lose contact with the customers turn millions of dollars over to the Alabama Treasurer’s Office. The State Treasury attempt to return the assets — cash, stocks, bonds, insurance benefits and even valuables from safe deposit boxes — to the rightful owners. Currently, the state has about $420 million in unclaimed assets, each year some small portion of that is released to the General Fund. The distribution was higher in 2015 than in 2014, but according to state financial officials the $20 million increase in the 2015 distribution was due to the normal variation.

Corporation Tax: The big jump in the revenue from this tax comes from a one-time distribution of $105 million from an escrow account. Money was being held in that escrow account to pay back companies that paid a now-defunct franchise tax. That tax was ruled unconstitutional, and the money has been gradually paid back from this escrow account set up to pay the claims. That payback process is now over, and the remaining money was deposited into the General Fund in 2015.

Use Tax: The use tax is the sales tax as applied to goods purchased from another state. Traditionally, sales and use taxes have gone to the Education Trust Fund, but in recent years the Legislature has shifted some of the use tax into the General Fund, adding a growth tax to the General Fund. The “Use Tax Remote” is the use tax on sales made across state lines over the Internet. That portion of the use tax has been growing at a healthy pace. For 2016, even more of the use tax will be shifted from the Education Trust Fund to the General Fund. The Legislature estimates that the change will add another $80 million to the General Fund.

Cigarette Tax: Revenue from the tax on cigarettes continued a multi-year decline corresponding to declining smoking rates. The 1 percent drop would have been steeper if not for a rush to stock up on cigarettes in September. Cigarette packs purchased in September weren’t subject to the 25 cents per pack increase that went into effect Oct. 1. The Legislature estimates the higher tax on cigarettes will generate $66 million in additional revenue in 2016.

Oil and Gas Production Tax: In 2015, revenue from this tax on the value of sales of gas and oil produced in the state declined by $30 million due to falling prices of oil and natural gas.

Alabama Trust Fund: Revenue from the Alabama Trust Fund declined. This distribution is based on the size of the state oil and gas trust fund. Since the state has been drawing $146 million a year out of the fund for the past three years to pay for operations, the regular distribution is shrinking, despite positive returns on investments. In 2016, the borrowing ends but the long term effect of the withdrawals will be felt for years to come.

Cellular Phone Tax: This tax on cellular phone minutes continues to drop since cell phone companies have been shifting customers to data plans, which are not subject to the tax.

Looking at other sources, higher revenue from alcoholic beverage sales drove up profits from the state’s Alcoholic Beverage Control Board. Revenue coming from the interest on state deposits was down as interest rates continue to be low. However, banks showed signs of better profits, leading to an increase in collections of the Financial Institutions Excise Tax.


Alabama Brings Home Disappointing Results on Nation’s Report Card

The National Assessment of Education Progress (NAEP) is a battery of tests given every two years to a representative sample of students in all 50 states. The test is designed to serve as a national scorecard, allowing comparison of educational performance across the states.

The 2015 results are out. They’re disappointing for the nation at large, and for Alabama, in particular.

In 2015, Alabama’s average math score, in both 4th and 8th grade, was the lowest of any state. Between 2013 and 2015, Alabama’s average score declined in both grades.

Among U.S. states, Alabama had the lowest percentage of students scoring proficient in 4th and 8th grade. Only 26 percent of 4th graders and 17 percent of 8th graders scored high enough on the NAEP to be considered grade-level proficient in math.

While Alabama’s higher poverty rate puts it at something of a competitive disadvantage in national comparisons, a deeper look shows it’s not Alabama’s demographics skewing the results. Name the group — black, white, Hispanic, poverty and nonpoverty — all perform worse than their peers in all other states.

Our neighbor to the west, Mississippi, continued a multi-year trend of improvement in 4th-grade math, surpassing Alabama and being recognized nationally for being one of the few places that saw an appreciable rise in math scores.

When it comes to reading, Alabama’s performance, particularly in 4th grade, had been a bright spot. In 2011, Alabama students matched the national average on the NAEP. But since then there has been a slight downward drift in 4th-grade reading. One minor victory: the average score in reading among Alabama 8th graders rose. However, the results still trail the national average.

It is worth noting that both nationally and in Alabama, the 2015 scores far exceed those posted by students in the 1990s.

In responding to the results, state department officials said the scores made it clear that the state has much work to do when it comes to preparing students for success. The Department plans to study the results and to query teachers to determine what is needed in terms of professional development, then work with school systems to see that it is provided.


Measuring Performance in Higher Education

K-12 education has been, in recent years, the subject of a massive amount of data-gathering and analysis. From individual classrooms to state boards of education, data is being used to evaluate, to tailor instruction, and to set goals and track performance. Through an examination of the data, we are asking questions: Are we producing the results we want to see? Are we investing public money wisely?

More recently, some of that attention has shifted to higher education.

Last month saw the release of a new College Scorecard by the U.S. Department of Education, a web-based, user-friendly presentation of data on institutions of higher learning.

Parents, students, and state taxpayers all have an interest in evaluating their investment in higher education. And the federal government is increasingly interested in the performance of higher education institutions since the entire apparatus of higher education relies heavily on federal financing, through grants and loans.

Many of the Scorecard’s statistics have long been available. In Alabama, the Alabama Commission on Higher Education (ACHE) is the centralized source of higher education data-gathering. ACHE produces regular reports on a wide variety of metrics and publishes them on its website. Collected nationally, these statistics have long been used by news organizations or other publications to rank colleges.

The new federal site makes the data more accessible, and it adds financial information about the earnings of graduates. Aggregated earnings and loan repayment information are drawn from tax returns filed with the IRS and matched with students who used financial aid to help pay for college.

As with any statistics, it is important to acknowledge the limitations of the data and also to consider it in context. The Department of Education plans to continue refining the data and its presentation. And this first publication is receiving both praise and criticism, as well as suggestions for how it might be improved in the future.

Here are a few of the limitations:

A) Earnings data is based only on students who used federal loans to help pay for college.

B) Average salary data mixes students who pursue a wide variety of professions, some highly paid and others that aren’t.

C) The socio-economic status of students entering colleges is highly correlated with student status after leaving college, thus any comparisons between schools should take the composition of the student body into account.

To further explain that last point: the effects of poverty that we see in K-12 education data don’t disappear in higher education. For example, we find lower graduation rates at schools where the majority of students come from low-income households. At those schools, students tend to enter with lower levels of college readiness, as reflected in lower average ACT scores.

Those students have often come from under-resourced or academically challenged schools. All public institutions, and, in particular, historically black colleges and universities make it a point to provide access to such students. That access is vital, but it’s equally important that students succeed once they are admitted.

Lower-income college students end up having to borrow more to finance a college education. They often face greater challenges staying in college and finishing on time because of financial pressures. The new figures show that schools that work with the most challenged students have lower rates of graduation and higher levels of debt on graduation. That is not particularly surprising, but the release of the new data is causing all colleges and universities to put more energy into keeping students in school and on track to graduate.

The new data also highlights the importance of Plan 2020, Alabama’s strategic plan for improving public education. Plan 2020 sets a goal of having all graduates prepared for college and career. All public school students now take the ACT college readiness test in the fall of the 11th grade. If a student fails to achieve a benchmark score on any of the ACT subjects, it indicates that student isn’t prepared for college-level work. Knowing that, a student and the high school can focus on those areas that need improvement.

If K-12 and colleges can cooperate in bringing these students up to proficiency before they graduate high school, those students would be less likely to need remediation once they reach college. They’d also be much more likely to graduate and move into higher earning professions.

Below is a presentation of results for Alabama schools drawn from the College Scorecard data. Use the tabs at the top of the chart to navigate through the data.


Alabama Statewide ACT Results for 2015

Alabama’s 2015 graduating class was the first in which all students took the well-known college readiness test, the ACT. New state-level reports on the 2015 results provide a wealth of information that can be useful to parents, students, and educators.

Before we take a closer look at Alabama’s results, it’s important to understand the benefits of having all students take the ACT. It’s also important to understand the consequences of that choice.

Students take the ACT to demonstrate they’re ready for college. Colleges use the results to help determine whether an applicant is admitted and whether he or she qualifies for a scholarship. Before public schools started offering the ACT, some students didn’t take it. For some, the cost was an issue. Some didn’t plan on going to college. Others might have had difficulty arranging to take the test outside of school and outside of school hours.

Now, all students have the opportunity to take the test in a convenient location at no cost to the student. This should increase college-going opportunity. And since the test is taken by high school juniors, students can focus during their senior year on areas of weakness, so that they can go to college better prepared to succeed. The ACT has four subject areas – English, reading, math and science. According to ACT, a student who scores at or above the readiness benchmark in the given subject has a 50 percent chance of making a B or better in a college-level class and a 75 percent chance of making a C or better.

The ACT is designed to test what a student has learned in school. Alabama has adopted another set of tests produced by ACT, the Aspire, to test children in grades 3-8 on what they’ve learned at each grade level. Aspire results are intended to predict roughly a student’s trajectory toward success on the ACT; students who exceed the readiness benchmark on the Aspire are expected to be on track to perform well on the ACT.

Alabama’s decision to give the ACT to all high school juniors makes a lot of sense. However, it significantly changes the pool of students taking the ACT in Alabama. Now, it’s not just the kids who plan to go to college taking the test; it’s everyone.

Alabama’s State Board of Education has set a goal of having 90 percent of Alabama high school students graduate and graduate prepared for college and career. The ACT is just one measure of whether those students are college and career ready. The ACT is designed to predict success at a four-year undergraduate university. Not every high school graduate is headed for a university. Some career-ready students will head straight into the workforce, into technical training, or the military. So, ACT results are not the only measure of career readiness. That being said, it’s a measure the state needs to see improve. Only 16 percent of the 2015 graduates were college-ready in all four subjects.


Since the 2015 results are the first in which all Alabama graduates took the ACT, these scores serve as a baseline from which to build. Alabama’s 2015 results shouldn’t be compared with results from previous years when the only students taking the ACT were those planning to go to college. However, the general pattern of results is similar: a higher percentage of Alabama students beat the benchmark in English and reading; while fewer are college ready in math and science.

Another caution on comparisons, comparing Alabama’s 2015 scores to the national average is not completely fair. At the national level, the pool of students taking the ACT is more heavily weighted with students who are college bound.

But Alabama’s new scores can be compared with those of 12 other states that give the ACT to all of their students. (For the record, ACT reports that 100 percent of Mississippi graduates took the test. However, according to the Mississippi Department of Education 2015 was the first year that all that state’s juniors took the ACT. That would indicate Mississippi results won’t be 100 percent of students until next year). In the chart below, you can look through the results subject-by-subject. You can sort the results by selecting the bottom axis and choosing the icon for ascending or descending results. There are two tabs on the top of the chart. The first allows you to look at the percentage of students who scored at or above the ACT benchmark for college readiness. The other tab allows you to look at the average composite score for each state in each subject area. You’ll notice some familiar patterns in the results and some surprises. Alabama outperforms Mississippi across the board while Kentucky and Tennessee consistently outperform Alabama. Somewhat surprisingly, considering North Carolina’s historic leadership in public education improvement, that state lags behind Alabama on some measures.

Giving the test to all was a brave step in honest reporting of education measures. Regardless of comparisons and statistical nuance, it is clear Alabama has significant room to grow in producing high school graduates who are ready for success in college. Fortunately, Alabama K-12 education does have a plan in place for improvement. Plan 2020 has strategies and goals that start with Pre-K and continue through to college and career success. Hopefully, as a result of these concerted efforts being made across the educational spectrum, we’ll see Alabama ACT scores rise over time.


Back to the Basics on Taxes and Budgeting

With the Governor and Legislature still at odds over how to solve a $250 million shortfall in the state’s General Fund, we thought it would be useful to again call attention to two essential underlying problems that explain why we are in the current predicament. PARCA has written about both recently and, over the past two decades, frequently.

1. Alabama state and local governments collect less tax revenue per capita than any other state in the United States. Governments here have less to work with when trying to provide services equivalent to those offered in other states.

2. Alabama doesn’t budget, in a meaningful sense. In the absence of a budgeting system that prioritizes investments and measures results, the Governor and Legislature simply try to balance revenue with expenditures, resorting to borrowing and shuffling money between accounts in times of scarcity.

Starting last fall, PARCA wrote about the building budget crunch coming in the state General Fund. Our annual meeting featured promising plans to unpack our overcrowded prisons and reform the way Medicaid works in Alabama. The long-term intent of both of those reform efforts were to put in place more effective approaches that would save money in the long run. Both plans will fall apart under the no-new-revenue General Fund budgets that have been passed and vetoed thus far. Failure to address the prison problems could lead to federal takeover. The potential damage to Medicaid will have serious consequences for the entire health care system. This memo produced by state agency heads this spring gives a concise assessment of what the no-new-revenue budget would mean for the courts, mental health, public safety, state parks, environmental enforcement, and a host of other state services.

The governor has proposed a package of taxes that his office anticipates would raise $300 million more per year. If that package were to pass and the projected revenue were generated, Alabama would still rank 50th in per capita tax collections.