Alabama public high school students’ performance on the ACT was down slightly in 2019 for the second straight year, after hitting a high point in 2017. Alabama students’ average score was 18.9 on a 36-point scale, compared to 19.1 in 2018 and 19.2 in 2017. Over the past five years, Alabama composite and subject scores have been stable, varying only in a narrow range.
Alabama public schools give the ACT in the junior year of high school. The final reported results here are for the students who graduated in 2019. Those students would have taken the ACT in 2018 at their own high school. If a student took the test subsequent to the administration at their high school, the student’s highest scores in each subject are counted in our data.
Interactive charts in this report allow you to explore the results at the state level and by system and school, subject, and year.

The results presented here are derived from data requested from the Alabama State Department of Education. It differs from what ACT publically reports for the state. ACT’s reports include private school students. PARCA specifically requested the scores of Class of 2019 graduates. The results show a slight but unexpected variance: a decrease in the statewide average composite score but increases in subject tests that make up that composite score. Though counter-intuitive, the variance is minor and can occur. There are more subject test scores than composite scores, which are only awarded when students complete all subject tests. Rounding can also play a part, and the scores in 2018 and 2019 are very close.

How Does Alabama Compare?
The ACT is a test of college readiness and is used by colleges as a factor in the evaluation of applicants’ qualifications for admission. Alabama is one of 17 states that give the ACT to all public high school students, whether they plan to apply for college or not. Among the states that give the test to all public high school students, Alabama ranks 14th. The average scale score among the 100 percent states is 19.5. Source: The Condition of College and Career Readiness, 2019. National ACT.

ACT Scores and College Admission
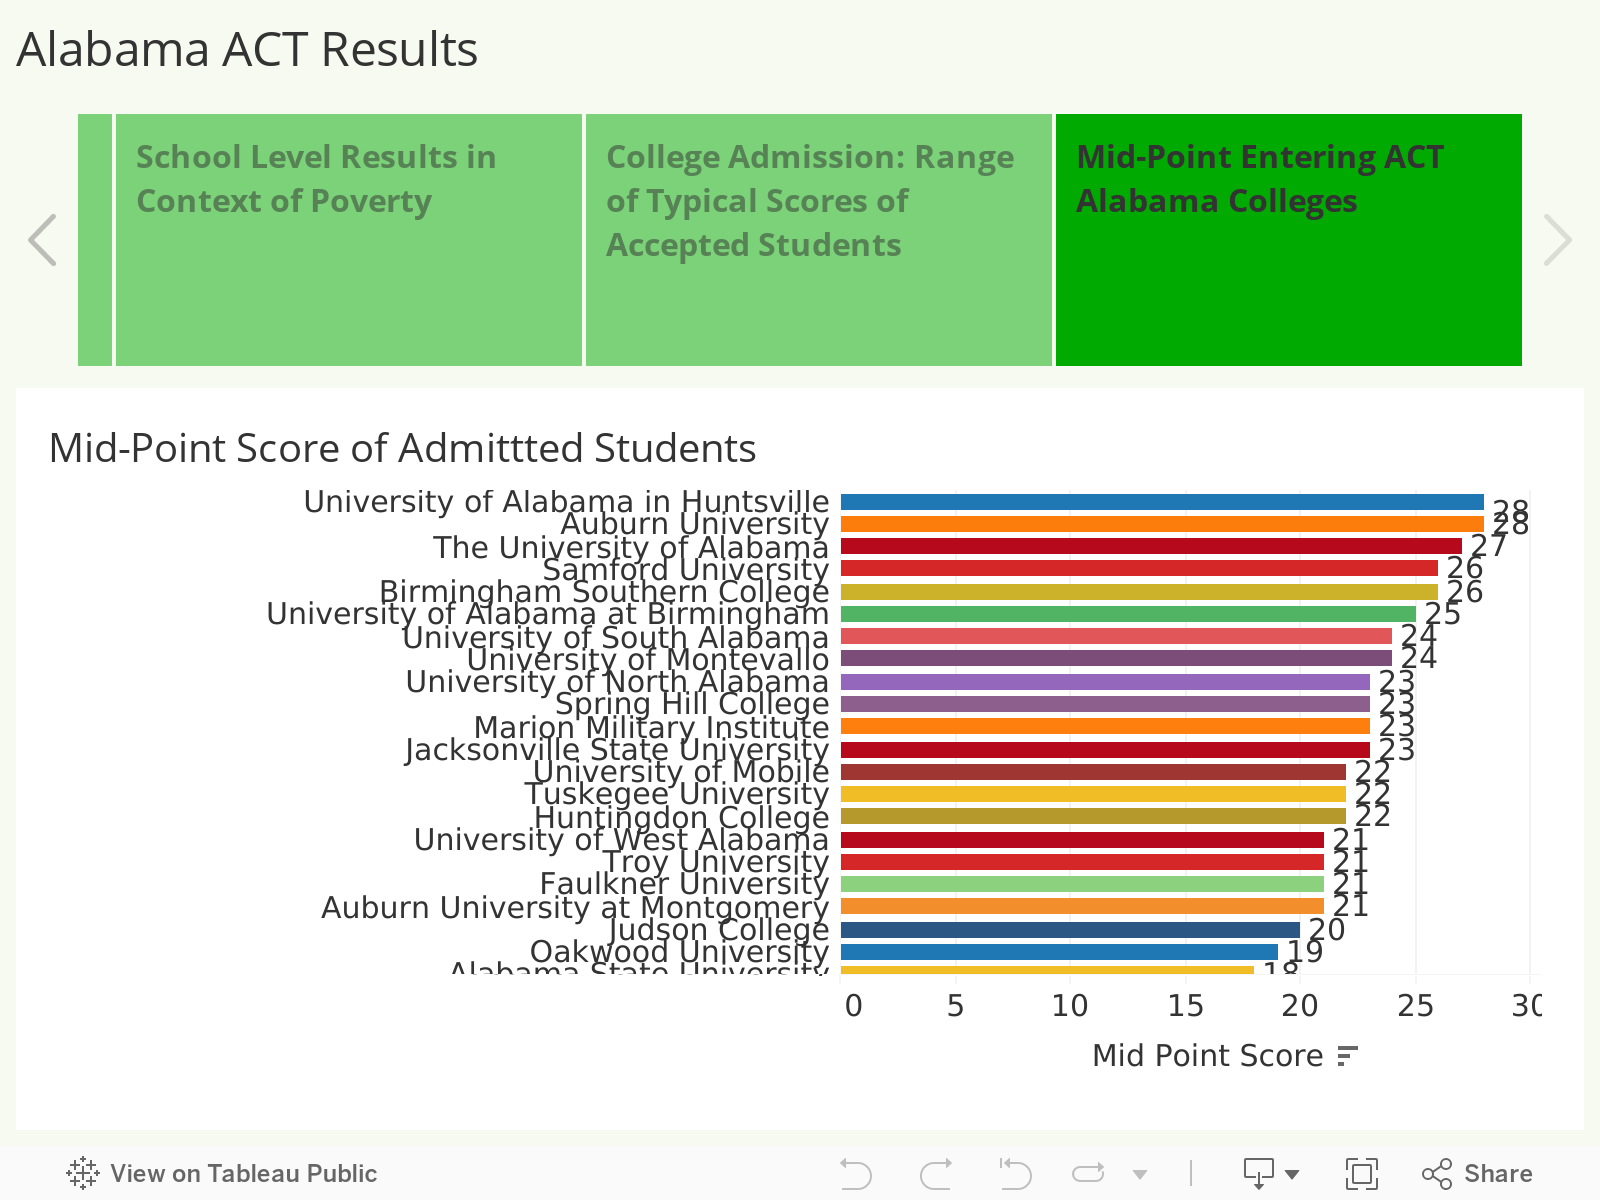
A composite score of 18 is considered a minimum threshold score for college admission at several state colleges. Others have lower thresholds, including open admissions. On the other end, a score of 25 or higher is expected at more competitive colleges, while 30 is the minimum threshold at some of the nationally elite schools. The table below lists the median entering ACT composite score of students admitted at Alabama colleges. Historically black colleges consider it part of their mission to admit students who may not have had the academic preparation to perform well on the ACT. Source: College Scorecard, US Department of Education.
There is a difference between making a score on the ACT that will help students gain admission to college versus a score that indicates a student is academically ready to successfully perform in college. institutions with lower admission standards generally have a lower percentage of students successfully performing in college courses and completing their studies with a degree.
ACT has established benchmark scores for the individual subject tests that determine whether, in their analysis, a student is ready for college material. Here, college-ready means the student has a 50% or greater likelihood of earning a B in a first-year college course in that subject. The benchmark score varies by subject:
- English College Ready Benchmark = 18
- Mathematics College Ready Benchmark = 22
- Reading College Ready Benchmark = 22
- Science College Ready Benchmark = 23
Source: What Are the ACT College Readiness Benchmarks?
Results showing the percent college-ready are shown below.
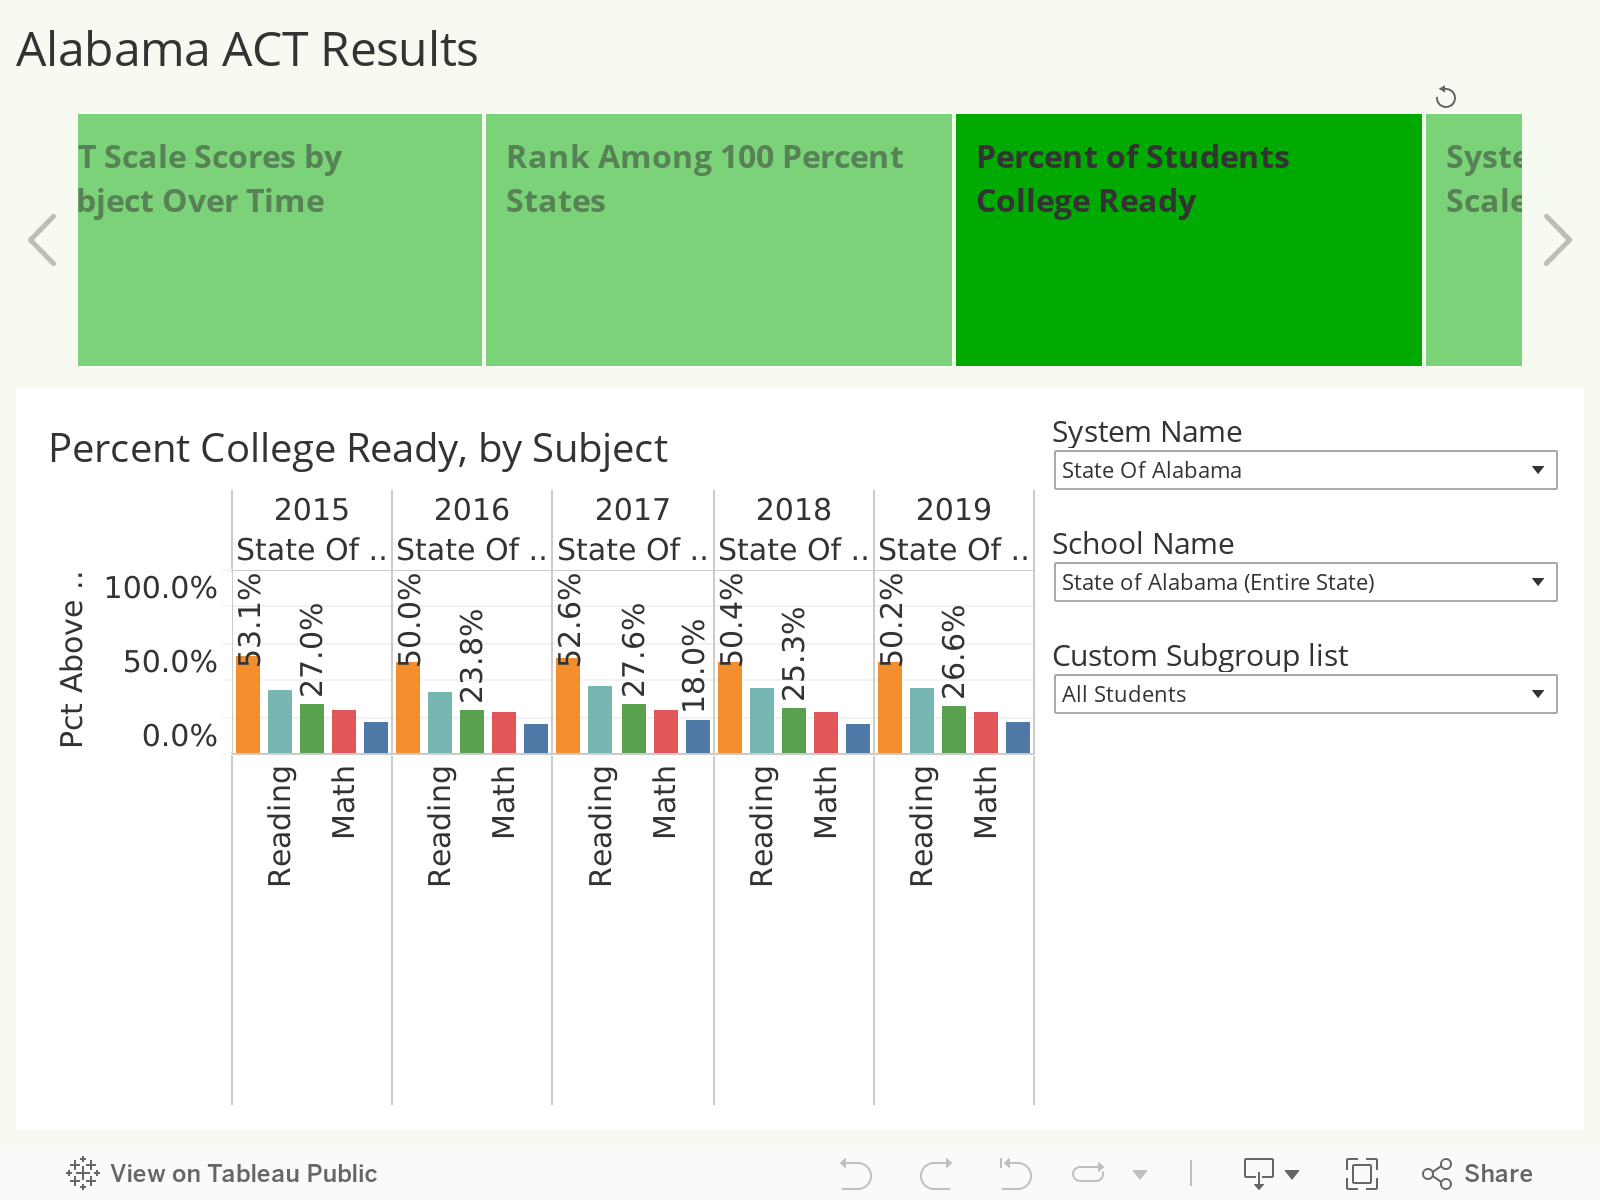
PARCA’s analysis shows that half of Alabama’s graduates in 2019 scored college-ready in English, followed by reading at a much lower percent. The lowest percent of college-ready is perennially in math. This level of college-readiness has been stable in Alabama over time. The ranking of subjects from English as the highest percent to math as the lowest is seen in most other states, though the gap between English and math in Alabama is quite large.
School Systems and Schools
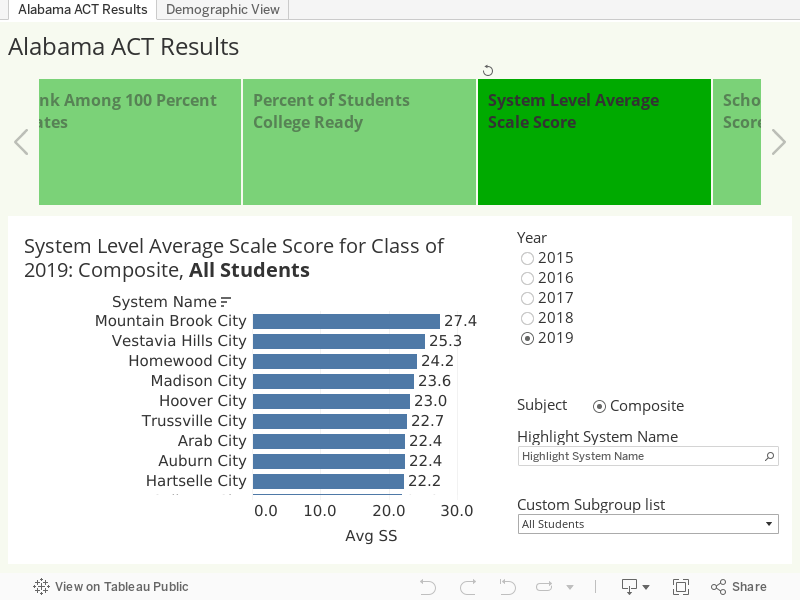
The top ten scoring school systems in 2019 includes:
- Mountain Brook City: 27.4 average ACT
- Vestavia Hills City: 25.3
- Homewood City: 24.2
- Madison City: 23.6
- Hoover City: 23.0
- Trussville City: 22.7
- Arab City: 22.4
- Auburn City: 22.4
- Hartselle City: 22.2
- Cullman City: 21.9
The same systems made up the top ten in 2018, though Arab City was below Auburn and Hartselle, and Cullman was ranked higher than in 2019. Back in 2017 Arab City was not in the top ten, though close. Homewood and Madison City have been battling it out for the third position over the past five years, though Homewood has firmed up that ranking over the past two years – experiencing significant growth in its average scores.
Systems and Schools Showing Improvement: 2015-2019
In 2019, 56 school systems in Alabama posted higher average composite scores on the ACT than they did in 2015. The ten systems achieving the largest increase in students’ average composite score over that period are listed below. A more complete listing can be found in the interactive charts.
| Rank | System | 2015 Average Composite Score | 2019 Average Composite Score |
|---|---|---|---|
| 1 | Homewood City | 22.80 | 24.15 |
| 2 | Chickasaw City | 15.50 | 16.84 |
| 3 | Fayette County | 17.98 | 19.12 |
| 4 | Thomasville City | 17.33 | 18.46 |
| 5 | Auburn City | 21.32 | 22.41 |
| 6 | Macon County | 15.25 | 16.24 |
| 7 | Trussville City | 21.73 | 22.70 |
| 8 | Linden City | 15.42 | 16.37 |
| 9 | Coosa County | 16.36 | 17.29 |
| 10 | Arab City | 21.59 | 22.41 |
Individual schools also showed noteworthy increases. Northridge High School in Tuscaloosa City jumped from an average composite score of 19.9 to 22.2, the highest gain in the state. They were followed by Hubbertville School in Fayette County, increasing from 17.03 to 19.10, and Sardis High School in Etowah County, which increased from 17.67 to 19.53.
Keeping Demographics in Mind
On average, students from economically disadvantaged families tend to score lower on standardized tests than students who are not at an economic disadvantage. Similarly, schools where a higher percentage of the student body is economically disadvantaged, the average test score tends to be lower. Scatterplot charts, like the one featured below, present test score data and student poverty levels at the same time. The vertical position of the school or system is determined by the average test score, while the horizontal location of the school or system is determined by the percentage of the student body directly eligible for a free lunch under the national free lunch program.
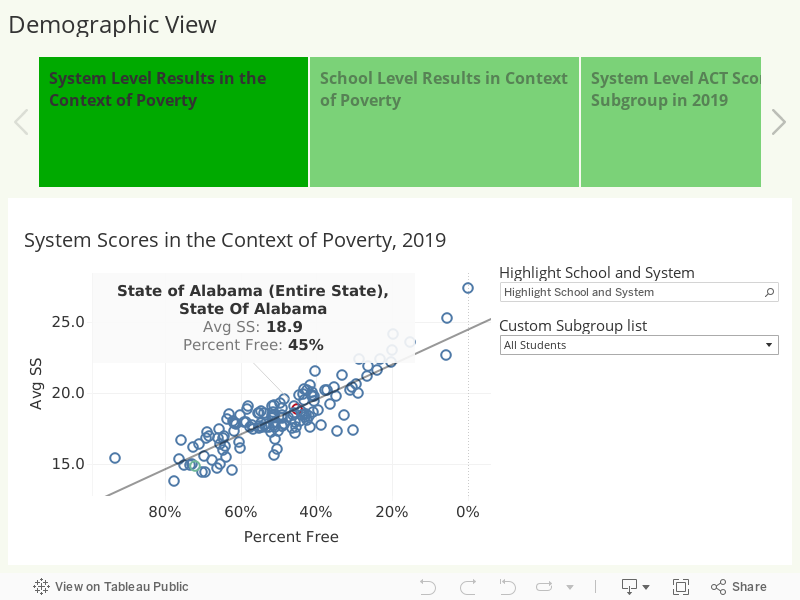
Systems and schools with substantial poverty above the line are exceeding expectations given their level of poverty, while those below the line are performing less than expected. Systems and schools close to the line are performing as expected.
When looking across subgroups Asians are the highest performing group. Higher performers are Asian or white, female, and non-poverty.

Among racial groups, Asians have the highest percentage of students scoring college-ready in all subjects, including English, followed by white students – though the gap between Asian and white students in math and science is large. The role of parent’s education level, family income, and coming from a college-going family and school culture plays a role across the results shown below.

The final chart in the demographic story looks at the percent college ready over time for subgroups. This interactive chart can be filtered for different subjects, school systems, and schools.