How does your school compare on the Aspire?

Take a look at the 2014 ACT Aspire results for Heard Magnet Elementary school in Dothan.

The following images show the percentage of students at each grade level scoring proficient on the Aspire, the state’s standardized test. Students scoring proficient on the tests of math and reading are considered to be on track to advance through their academic career toward an ultimate goal of graduating from high school ready to succeed in college level coursework.

The charts show the results for All Students at the school and also display the results for students who qualify for the free or reduced lunch program (identified as “Poverty” in the chart), and also for the students who don’t qualify (“Nonpoverty”).

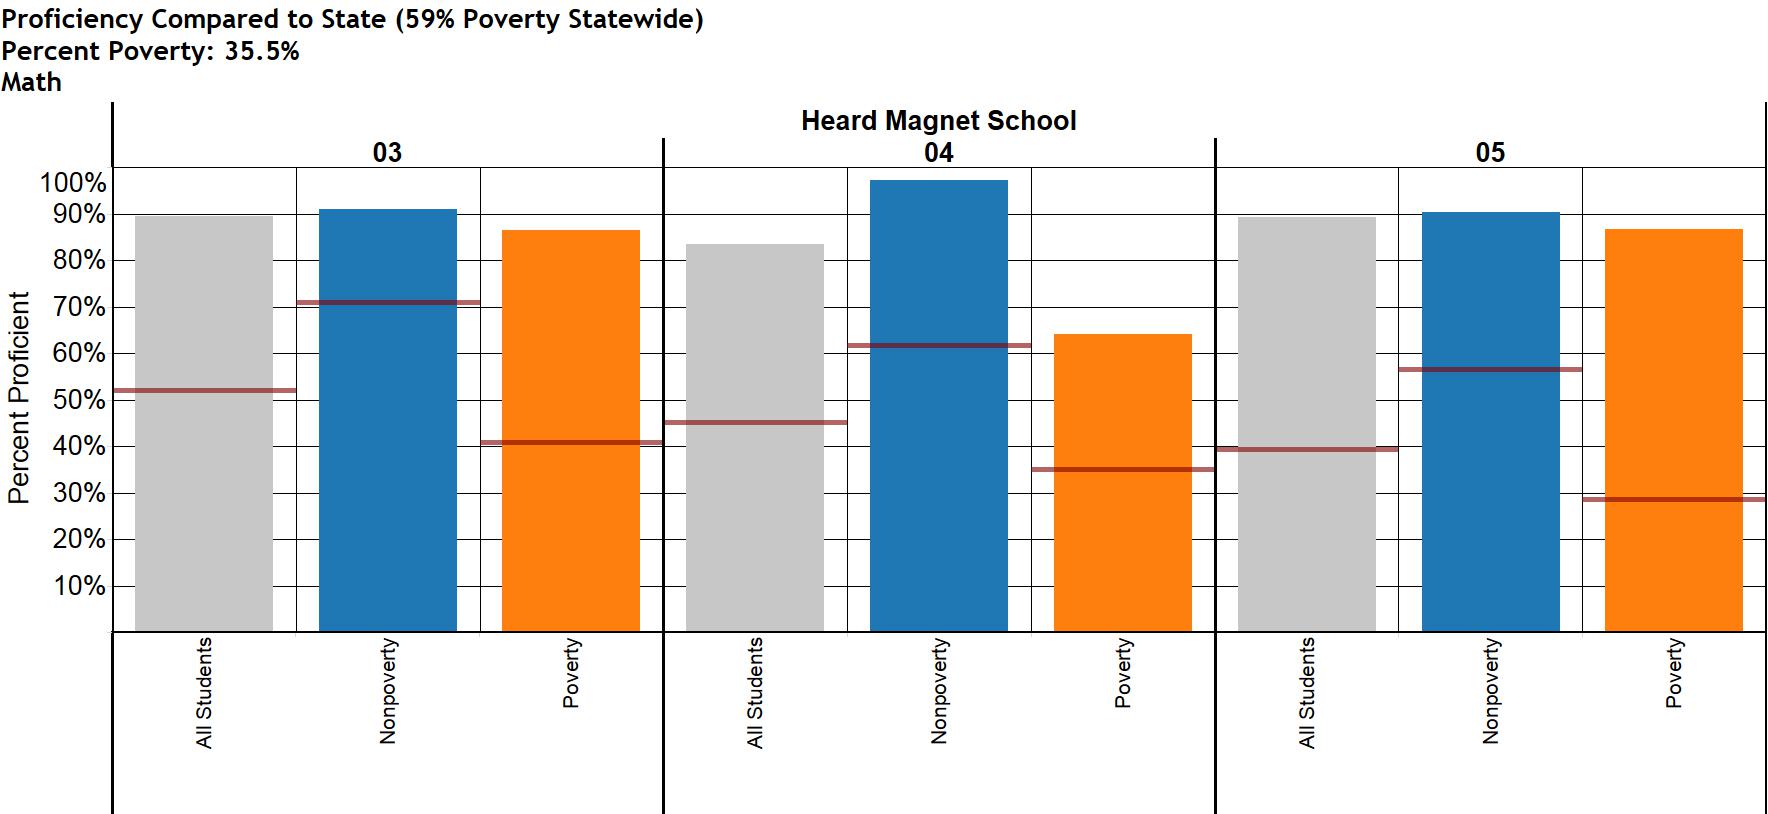
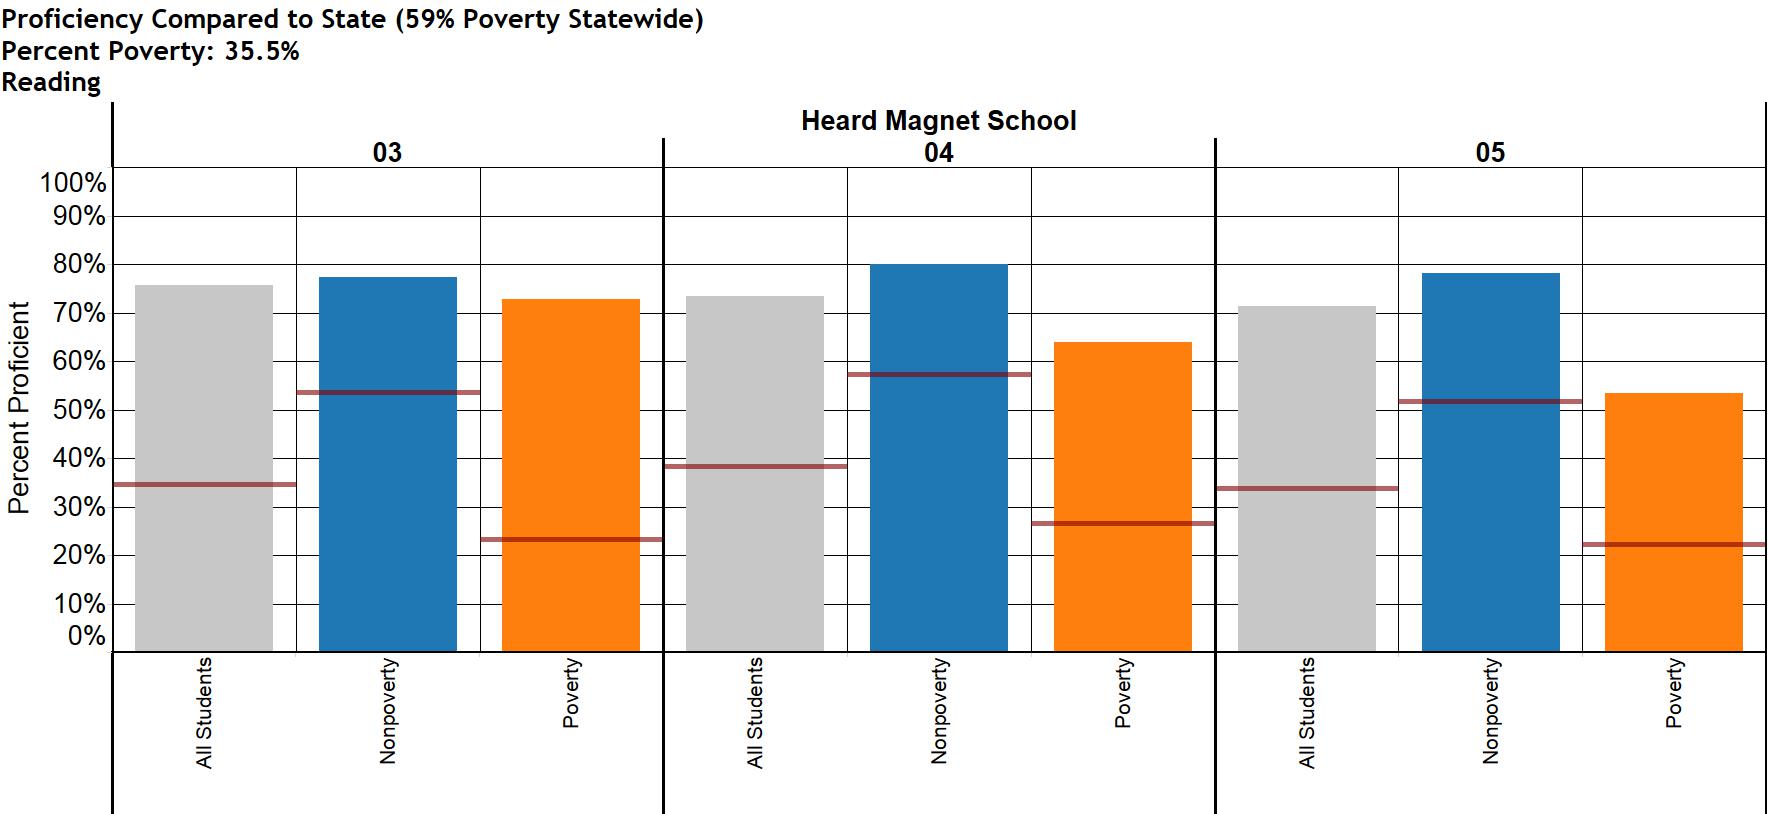
What do we see at Heard? Here are some important things to note:
1. High percentages of students are academically on track. The percentage of proficient students at Heard is far above the state average proficiency rate (The state average is represented by the red reference line).
2. The gaps in performance between students from poverty households and students from nonpoverty households are relatively small. In some grades, the success rate for poverty and nonpoverty students is practically the same.

Heard’s results are an exception. In general, across Alabama, there is about a 30-point gap between the success rate of nonpoverty and poverty students on these benchmark tests. That’s true in both reading and math. However, Heard’s results are proof that the performance gap is not inevitable.  Similar results can be found in schools around the state.

It should also be noted that Heard has some advantages on these performance measures. It is a magnet school. It is drawing students and parents that have high expectations for academic success, which may mean that it isn’t working with the children who have the highest degree of disadvantage. Also, Heard’s student population doesn’t have the same concentration of poverty as other schools in the state. About 36 percent of Heard’s students are in the poverty subgroup. Statewide almost 60 percent of children are in that poverty subgroup. At some schools, virtually all the children come from poverty households. When we look at results statewide and across subjects and grades, a lower percentage of students achieve the proficiency benchmark in schools where poverty is more concentrated. All these considerations should be kept in mind when viewing and comparing school results.

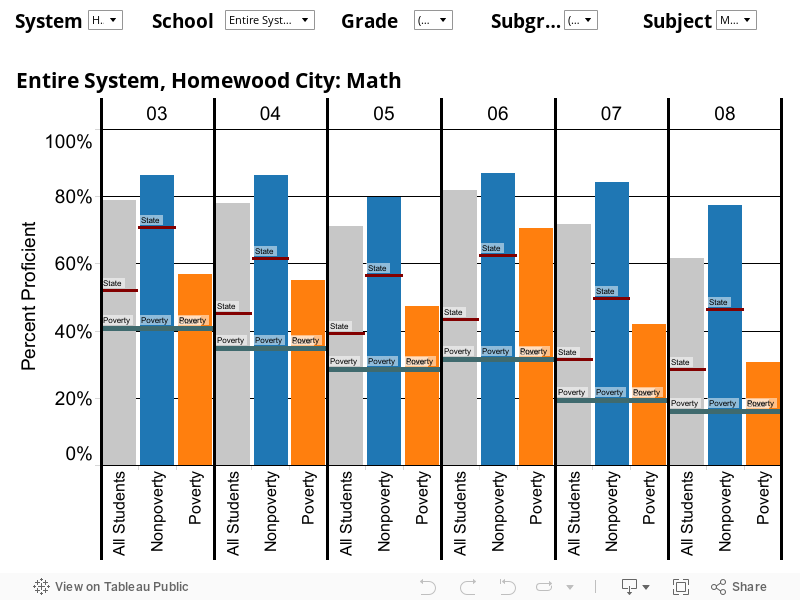
Previously, we launched a tool for viewing 2014 ACT Aspire results that allowed you to look at your local system’s results in comparison to the state average. The default view in that tool showed separate results by grade for All Students, for Nonpoverty students, and for Poverty students. Below, we’re making a new tool available, one that allows you to look at the 2014 ACT Aspire results at the school level.

In the table below, you can look at 2014 ACT Aspire results, school-by-school, for grades 3-8. As at the system level, this tool will allow you to look at results for the various demographic subgroups available.

You’ll notice that in this view we’ve included a blue reference line labeled “Poverty.”

This is the statewide percentage of students from the poverty subgroup who scored proficient on the Aspire test in the featured grade level and subject. We include that reference line because in some cases, the state did not publish a Nonpoverty or a Poverty result. The state withheld those results in cases where the number of students in one of the groups was small enough that the reported scores might be linked to individuals.

In cases where the Poverty and Nonpoverty results are withheld, only an “All Students” result will appear. That scenario tends to occur most often in high-poverty schools and school systems. That is why we included the Poverty reference line, so that the All Students result can be compared to the statewide proficiency percentage for students for poverty households.

In subsequent posts, we plan to make available additional capabilities, like the ability to compare multiple schools or school systems on individual measures.


PARCA’s school analysis for Dothan


Each year, PARCA travels to Dothan to present data on the city school system to educators, parents, and the public.

The PARCA analysis, sponsored by the Dothan-based Wiregrass Foundation, presents Dothan City School enrollment, financial data, and test scores results as they compare to peer school systems and to state and national averages. How does the system stack up over all? How do students from poverty backgrounds perform compared to similarly-situated students statewide? How do nonpoverty students perform compared to peers elsewhere? What is the system’s ultimate success rate in preparing students for college as measured by the ACT (the college readiness assessment) and by the rate at which Dothan students have to take remedial education courses after enrolling in college?

The deep dive into the data is part of the Dothan City School System’s commitment to continuously improve. The analysis provides a basis for understanding the test results. The system takes ownership of the results, providing an opportunity to celebrate successes, but also to identify areas in need of improvement. Strategies are developed to counter weaknesses. Resources are devoted to those strategies, and future results are monitored.

It’s an approach that has led to success. In 2005, over half of Dothan’s system-level results on the Alabama Reading and Math Test were below the state average. By the 2012-2013 school year, all the system’s results were at or above the state average.

Starting in 2014, Alabama changed its statewide assessment test to the ACT Aspire, and it was the results of the new test that were presented this week, along with financial data and college readiness results from ACT. Dothan’s baseline results showed that on the new tests, Dothan, as a system, bested the state average on most measures. However, when the results are viewed at the school and grade level, it is clear there is room for improvement. Like school systems across the state and nation, Dothan sees a wide disparity in results between poverty and nonpoverty students. Dothan schools with high percentages of poverty in the student body generally showed results that trailed far behind state averages. On the other hand, on several measures, poverty and nonpoverty students at Dothan magnet schools scored proficient at almost the same rate, erasing that stubborn achievement gap. In fact, in some grades and subjects, poverty students at Dothan magnets beat the proficiency rate of non-poverty students statewide.


How does your school system compare with state averages?

PARCA has been working on a new system for presenting information about Alabama’s public schools.

In the next few posts, we will be rolling out some tools that we hope educators, parents, students and communities will find useful in understanding how their local schools stack up: where they are succeeding and where they might improve.

Our first offering is a way of looking at ACT Aspire results from 2014. The display below compares the performance of Alabama systems with the state average result for students in grades 3-8 in either reading or math. The results represent the percentage of students who scored at or above the level the state considers proficient at that grade level. The state average result for all students is represented by the red reference line in the graphics.

You can explore the results by picking which system you want to compare with the state.

You can look at the results for all grades or choose to focus on one.

You can also choose to look at the results by demographic subgroup. By default, the results displayed are for the following subgroups of students within the system: “All Students,” “Nonpoverty,” and “Poverty.” You can choose to add other subgroups to the comparison or focus on a specific one.”

Across the state, you’ll note gaps in the results between various subgroups.  Students from poverty households tend, as a group, to perform less well on these tests than students from nonpoverty backgrounds. It’s true here and it’s true across the country. It’s one of the great challenges of public education. It’s also true though that kids from poverty backgrounds perform better in some systems than in others. This creates the potential to learn from those successes and replicate best practices.

These were tests administered in the spring of 2014. Students across the state are currently taking the ACT Aspire for 2015. 2014 was the first year the ACT Aspire was taken statewide. Because it’s the first year of a new test, results were slow to be published. It is hoped that results from the testing going on right now will be available much more quickly. And we plan to be in a better position to analyze and publish them quickly. The Aspire tests are one of the cornerstone measures in the state’s strategic plan for educational improvement, Plan 2020.  In future posts, we’ll present additional avenues for looking at Aspire data and will explore the results of other measures that are part of Plan 2020.